
Karteikarten
CT3
Karten in diesem Stapel (50)
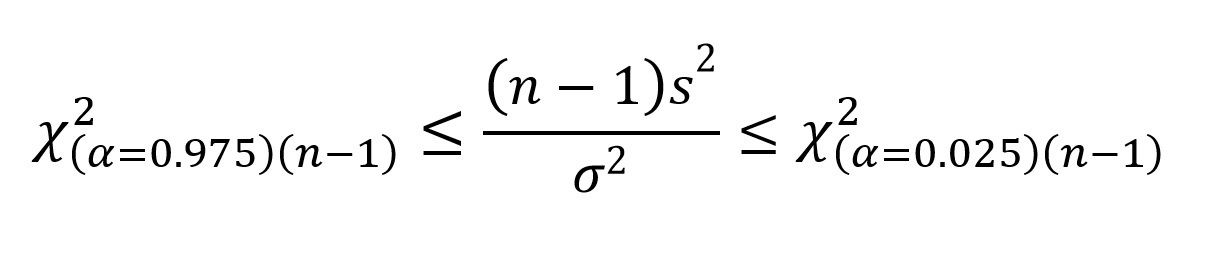
- 1Confidence Interval of Standard DeviationThis is for 95% confidence, adjust accordingly. Don't forget to get the square root since is SD not just the deviation.
- 2Normal distribution with mean u and var 20. Find confidence interval.
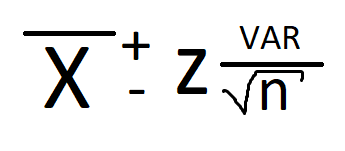
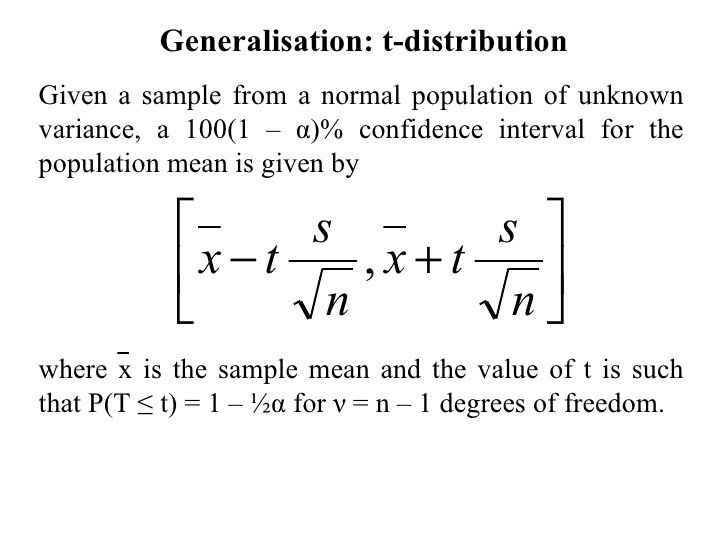
- 3Find the confidence interval when population variance is unknown.
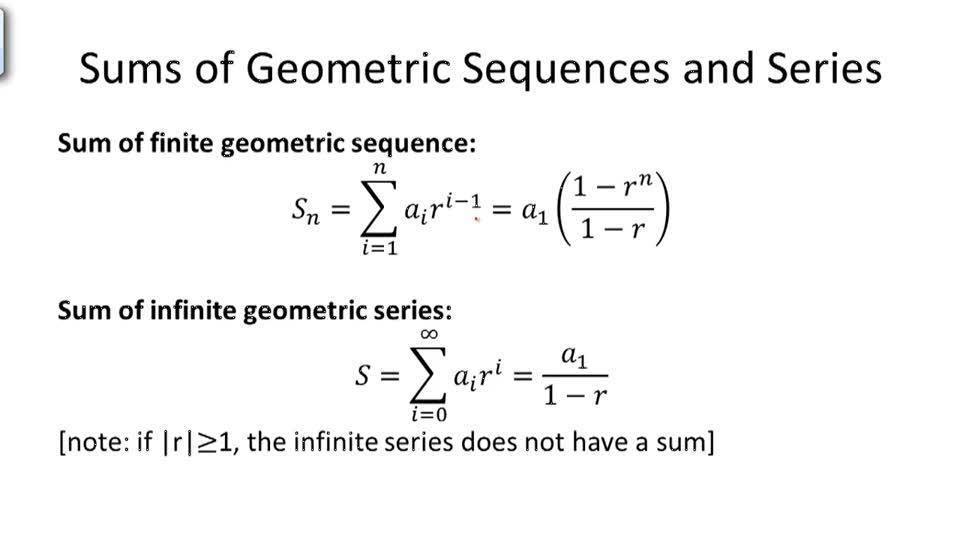
- 4Geometric Series formulas
- 5Maximum likelihood FormulaUse F(x) to find the probabilities.
The constant arises from the different possible arrangements of the obs.
- 6Binomial confidence interval formulawhere B(100,p) = N (np, np (1-p)
ConInterval = P ( -Z1 < Z < Z2)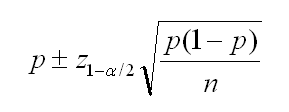
- 7Obtain the bias of u from a poisson distribution

- 8Obtain the MSE of u of a poisson distribution

- 9Cramer-Rao Lower Bound Formula
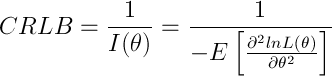
- 10Comment on the accuracy of a Poisson interval.Approximation is better in large parameter values.
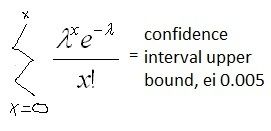
If an estimate for variance is used then is not accurate. - 11Calculate the accurate Poisson confidence interval. (99%)You will need to do this calculation twice, and change the interval to lower such as 0.995.
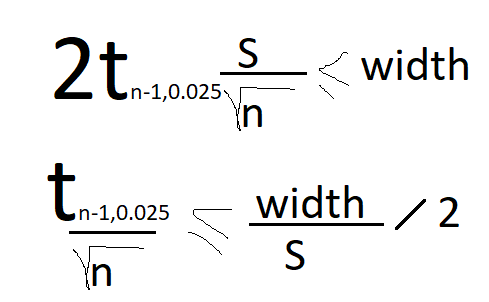
- 12Calculate the minimum sample size.
- 13Comparison of two means
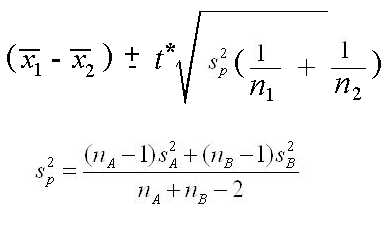
- 14Comparison of Ratios
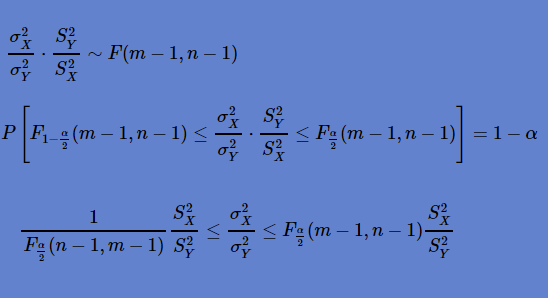
- 15Confidence interval for mean when given chi square.
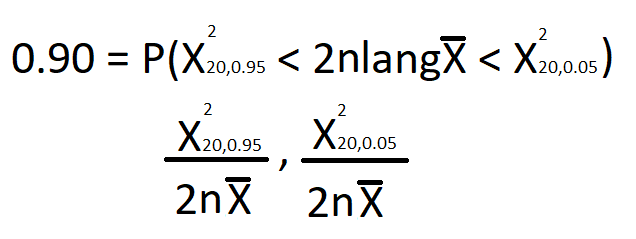
- 16Find the asymptotic standard error of the mean.
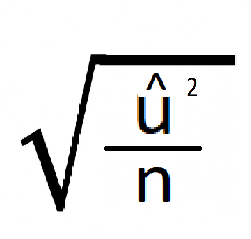
- 17Describe a type 1 and type 2 errors.1: Probability of rejecting Ho when it is in fact true.
2: Probability of accepting Ho when it is in fact false - 18Describe Neyman Pearson testLikelihood under Ho / likelihood under H1 < critical value
- 19We have carried out a 5% one tailed statistical test. We have found Z > 1.768 = 1 - 0.96147 = 0.03853. What would be your analysis.Since found probability is less than 5% we have sufficient evidence to reject Ho.
- 20We have carried out a chi square test and found our result to be 7.91. At two tailed 95% confidence level, what is your analysis? (n=5)7.91 lies between the lower and upper points of the chi square table, (at 2.5% and 97.5% confidence). Thus we have insufficient evident to reject Ho at the 5% level.
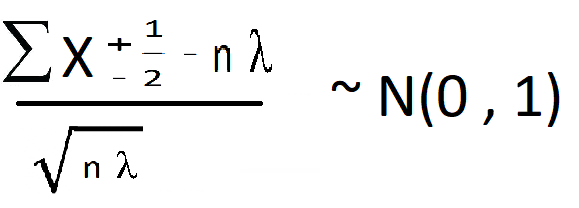
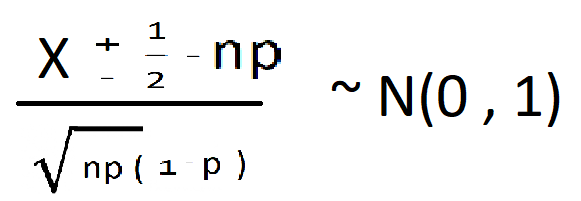
- 21When would you need to apply continuity correction?When working with binomial and poisson trials, +- 0.5 to X. You adjusted it to be closer to the mean.
- 22Poisson testing the value of the mean.
- 23Binomial testing the value of the mean.
- 24We have carried out a poisson trial with 1% level of confidence and found the result to be -2.519.At 1% confidence level the lowest point is -2.3263. -2.519 is lower hence we have sufficient evidence to reject Ho.
- 25We have carried a one tailed test to find the difference between two means, we have found the statistic to be 1.15. What are your findings? (95% n1=10 and n2 = 10)From the t tables we know that at P=18 and 5% confidence the value is 1.734. 1.15 is less than this thus we do not have sufficient evidence to reject Ho.
- 26Two samples in binomial distribution
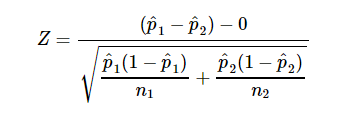
- 27We carried a two tailed test of 95% and found P to be 2.36 (binomial population). What analysis can we take from this testThe critical region of a two tailed at 95% confidence interval of Z is 1.96 (0.975 and 0.025). 2.36 is greater than 1.96 thus we can conclude we have enough evidence to reject Ho.
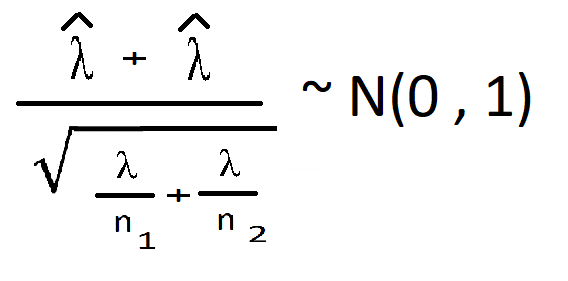
- 28Poisson two populations
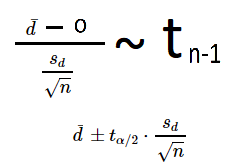
- 29Paired Data
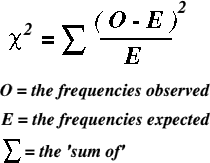
- 30Chi Square Test. (one tailed)
- 31Contingency Tables. Degree of freedom?Row Total x Column Total / Total Table
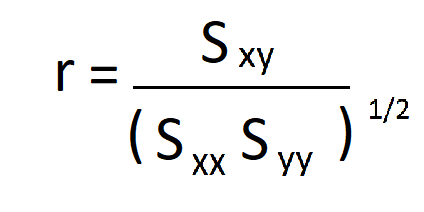
degrees of freedom = (R-1)x(C-1) - 32Sample Correlation Coefficient
- 33Explain the meaning of -1 < r < 1r = 1, perfect linear relationship
r {0,1} = Not direct relationship but same direction
r = 0 no linear relationship
r{-1,0} = Opposite directions no direct relationship
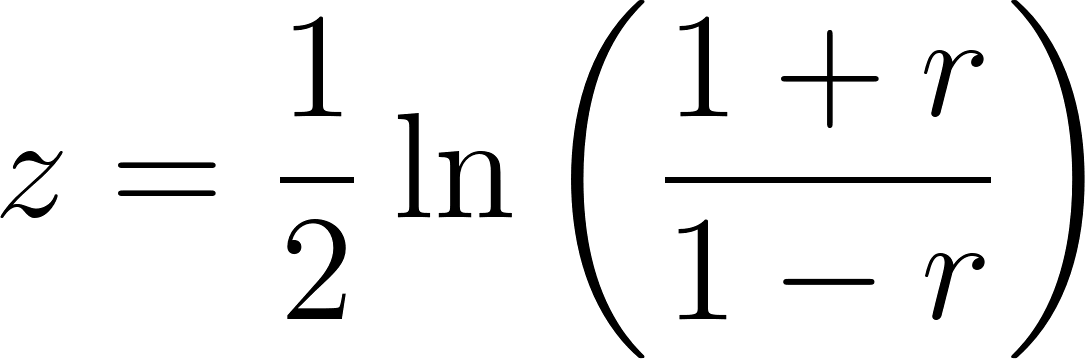
R = -1 different directions but perfect linear relationship - 34fishers transformation of r, often described with Z or W
- 35Mean and SD of W (fishers transformation)
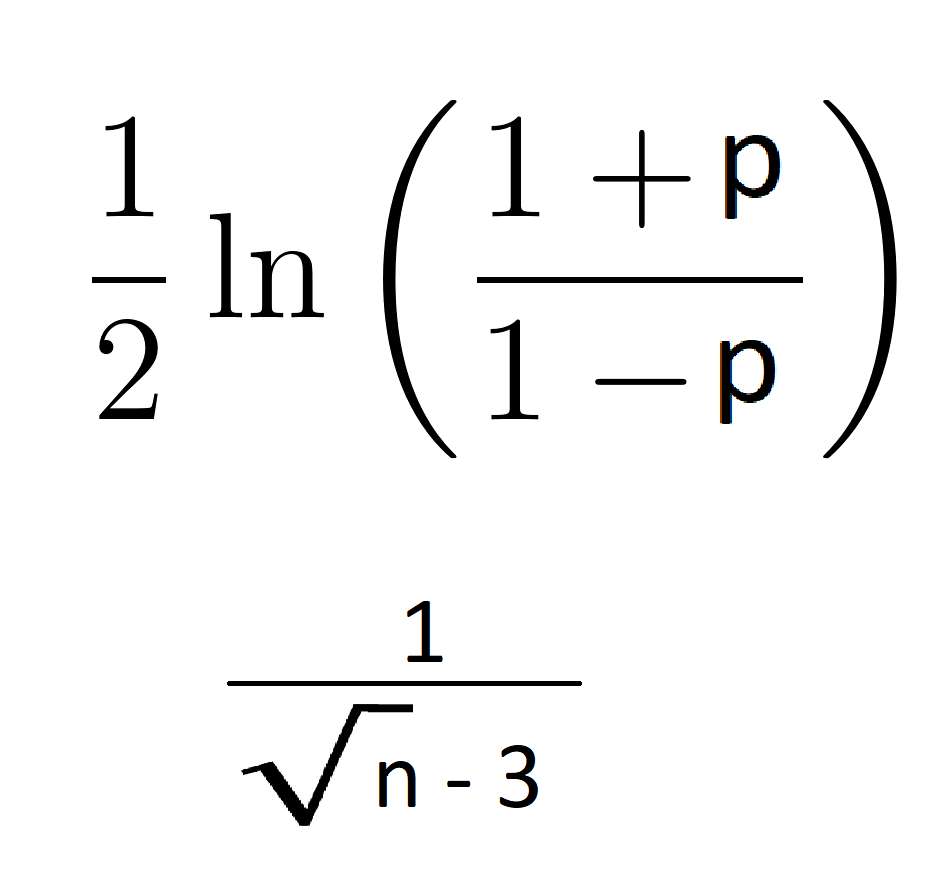
- 36Linear Regression Model
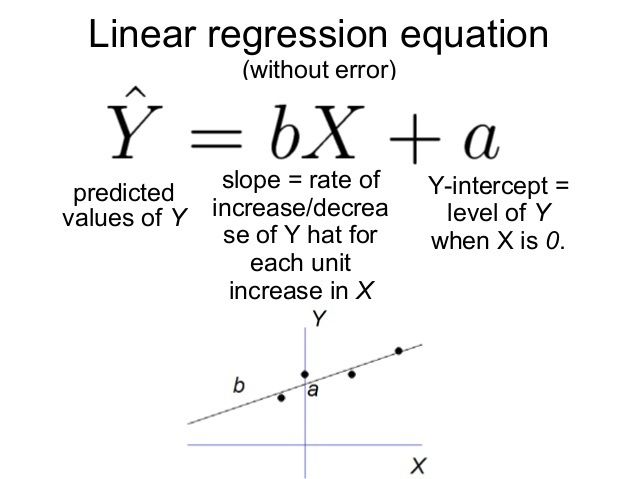
- 37Anova Table

- 38Describe the difference skewness levels
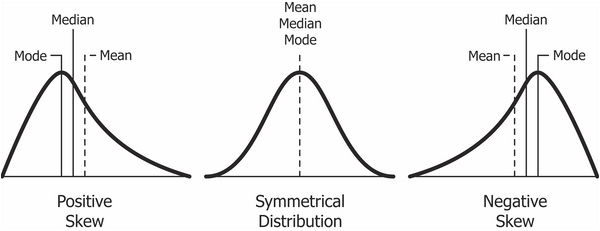
- 39Calculations with Skewness
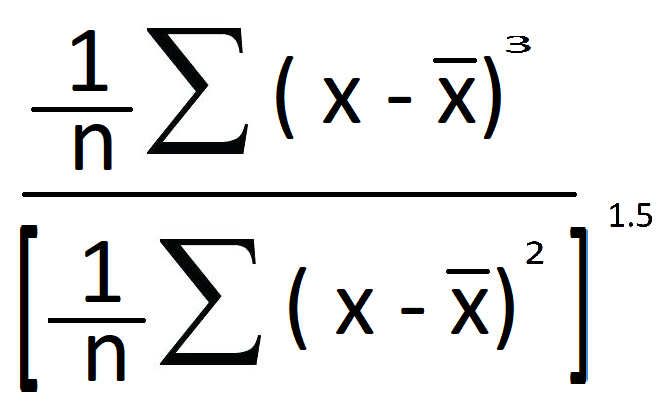
- 40Permutation with repetitions and order does matter
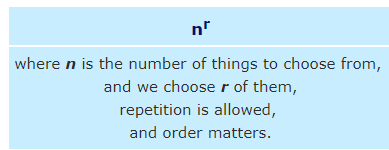
- 41Permutation with NO repetitions and order does matter
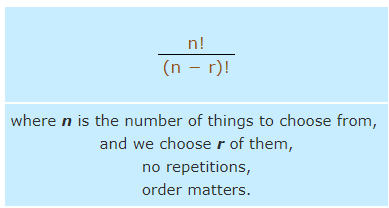
- 42Permutation with NO repetitions and order does NOT matter
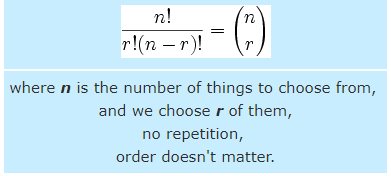
- 43Permutation with repetitions and order does NOT matter
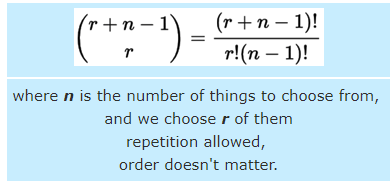
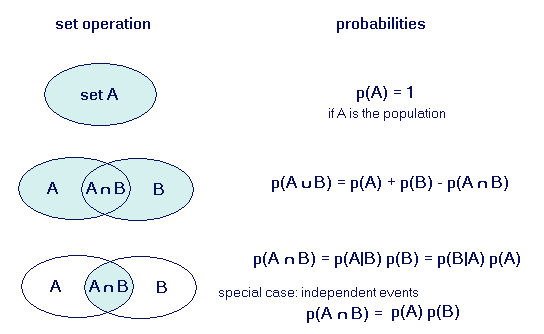
- 44Probability of A and B. Probability of A or B.
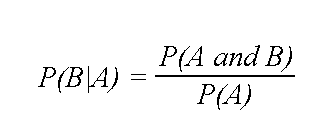
- 45Probability of B given A
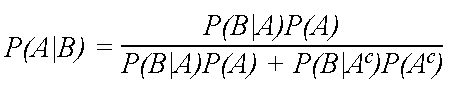
- 46Probability of A given B
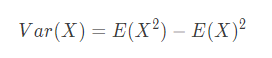
- 47Calculation of variance
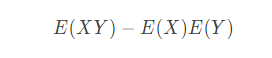
- 48Calculation of covariance
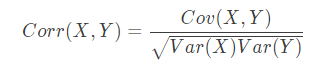
- 49Calculation of correlation
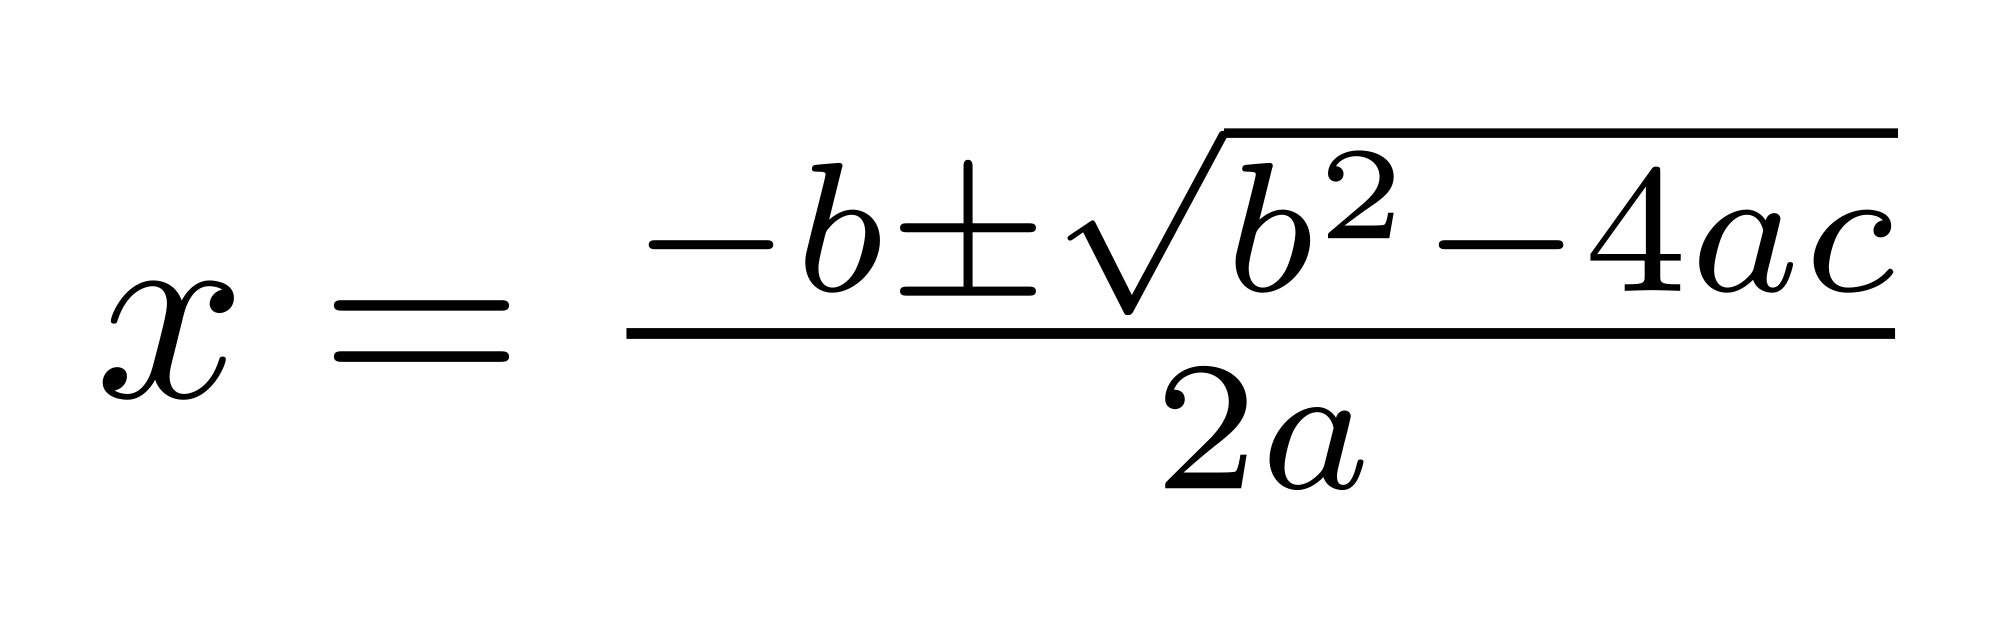
- 50Quadratic Equation
Informationen
- Beschreibung
- Karteikarten am CT3, erstellt von Raquel Stokes am 21/07/2018.
- Erstellt von
- Raquel Stokes
- Aufrufe
- 0
- Bewertung