
Karteikarten
Simple linear regression
Karten in diesem Stapel (13)
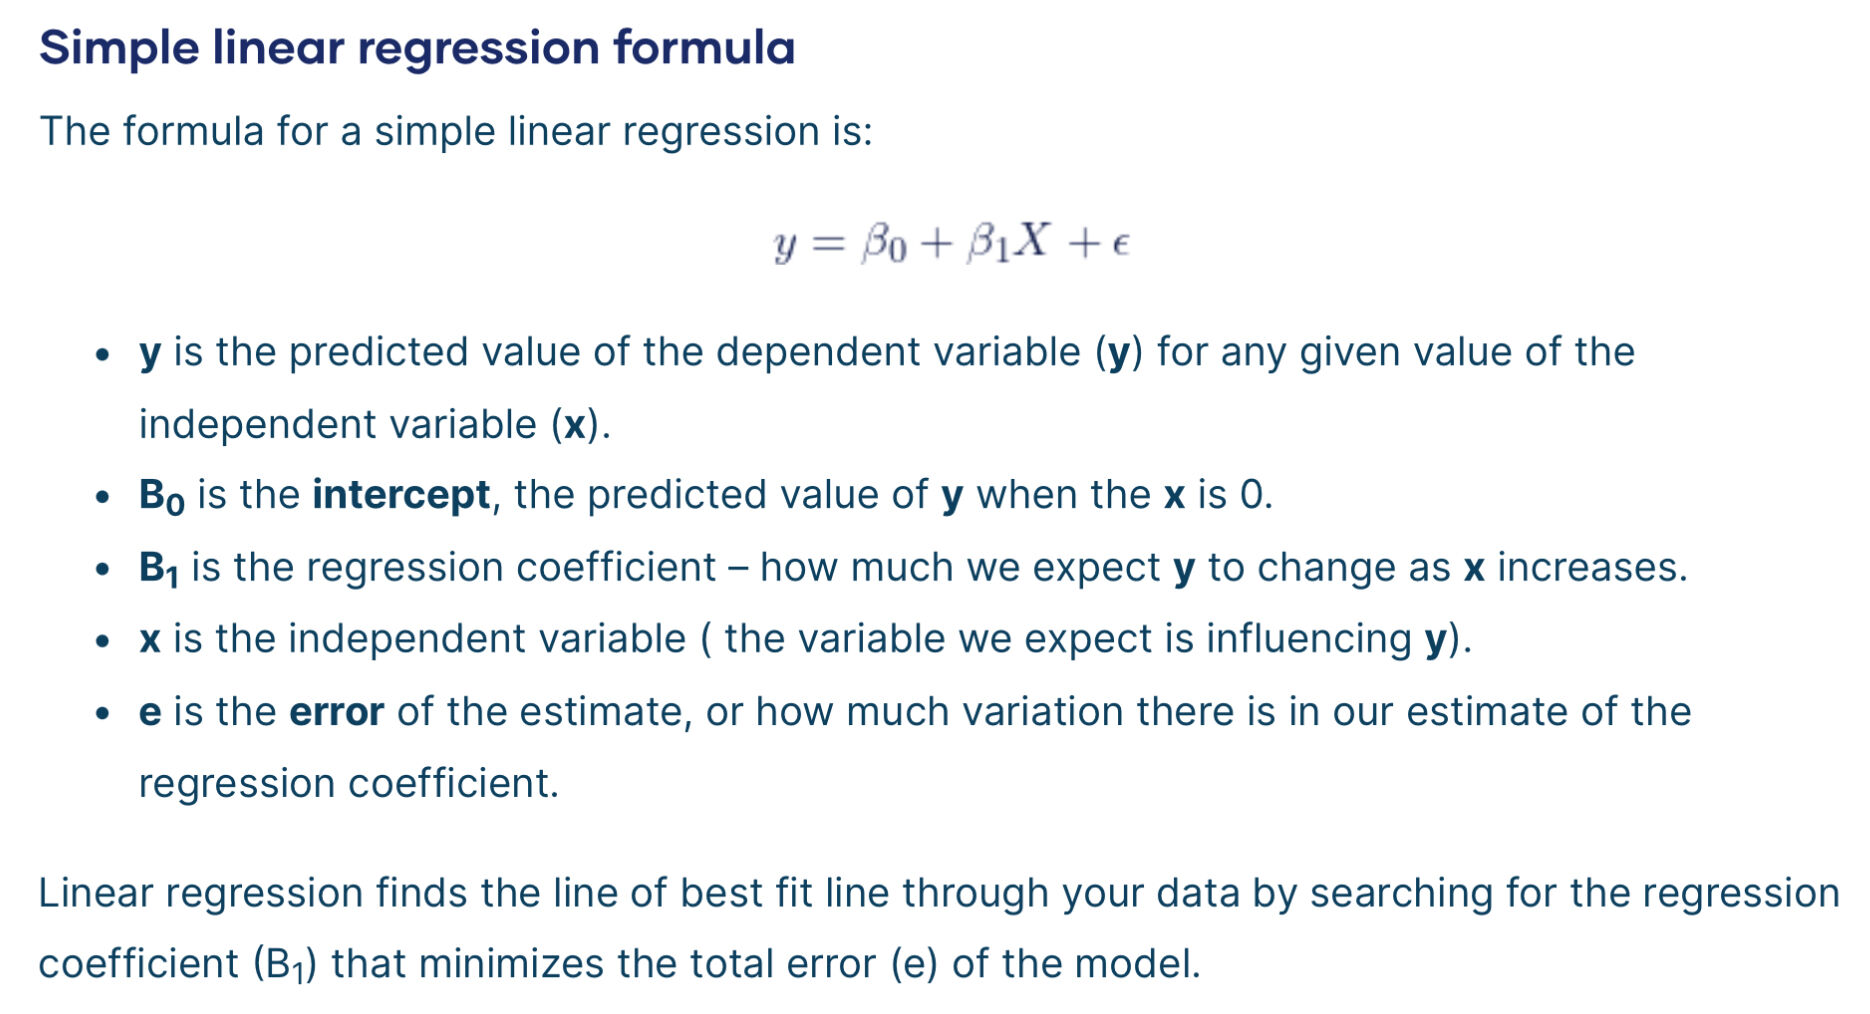
- 1What can a “simple linear regression” be used for?- Examining how strong the relationship is between one response variable and one predictor variable
- Estimating the value of the response variable at a certain value of the predictor variable (e.g., the amount of soil erosion at a certain level of rainfall) within the range of our dataset!. - 2When do we use a “simple linear regression”?When these assumptions are met:
- Homogeneity of variance (homoscedasticity)
- Independence of observations:
- Normality:
- The relationship between the independent and dependent variable is linear
- Continues data / numeric data - 3What is ” Homoscedasticity”?Homoscedasticity: The variance of the response variable does not change with the value of the predictor variable.
- 4What is “Independence of observations”?Independence of observations: Each observation is independent of the others - the value of observation x is not affecting/being affected by the value of observation y.
- 5What is ”Normal distribution”?Normality: “The response variable or the residuals of the model are normally distributed”
- 6What is “linear relationship”?Linear relationship: “That there is a linear relationship between the predictor and response variable i.e. follow a straight line”
- 7How can we check for the assumptions of a simple linear model in R?Plot(lm)
- 8How can we create a simple linear model in R?lm(response variable ~ predictor variable, data = Dataset)
- 9Show me an example of the output from plot(lm)? Explain what you are looking for?USE WEBPAGE FROM MICHAEL
- 10What is a “simple linear model”?
- 11How do we interpretate the results from a simple linear model in R?Summary(lm_model)
- 12Show me an example of the output from summary(lm_model) and explain the interpretation:- P-value < 0.05
- Coefficient —> (intercept) = estimate for response variable
- USE Equitable equations or so from Youtube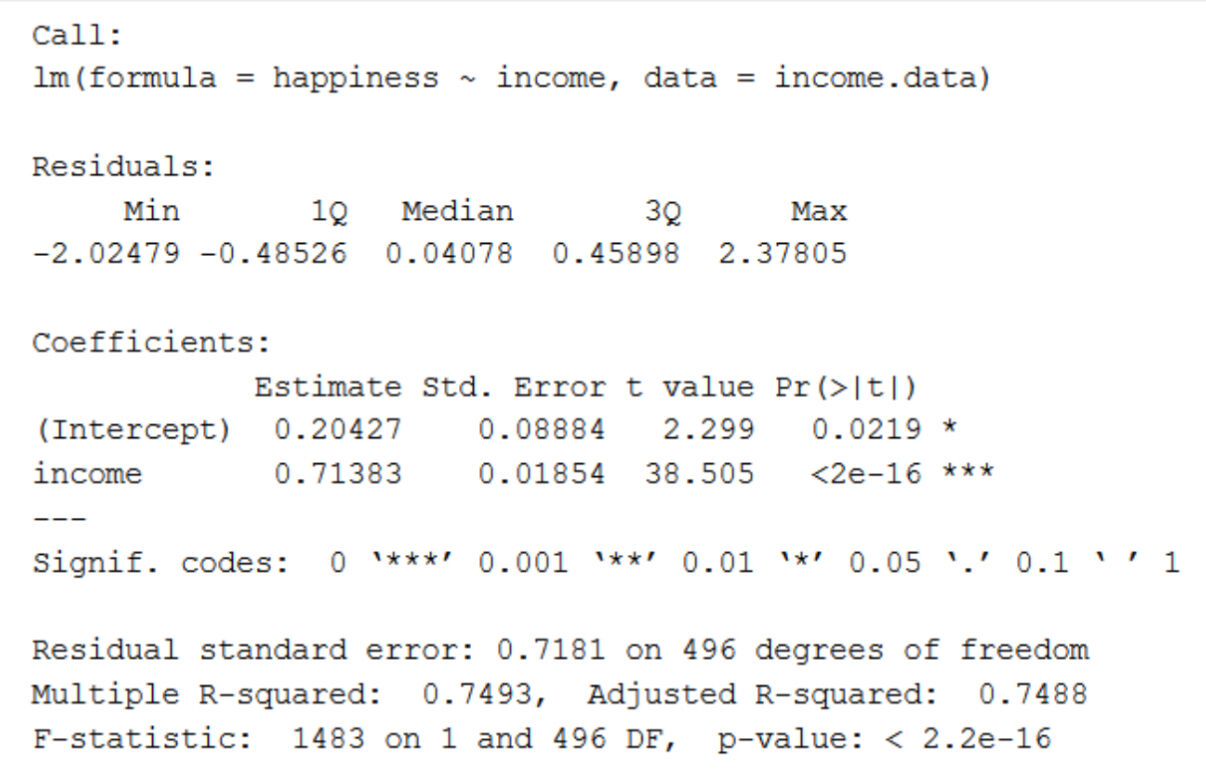
- 13What is “residual”?Residual: “The difference between the actual value and the value predicted by the model for any given point”
Informationen
- Beschreibung
- European species Statistical and Geospatial Modelling (Regression Analysis) Karteikarten am Simple linear regression, erstellt von Marie Skalshøi am 13/03/2025.
- Erstellt von
- Marie Skalshøi
- Aufrufe
- 0
- Bewertung