
Karteikarten
EC113 - Descriptive Statistics
Karten in diesem Stapel (27)
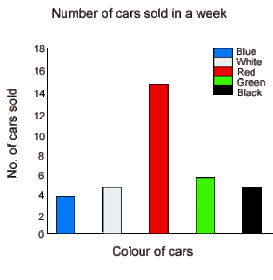
- 1o Bar ChartA method for summarising a set of categorical data. Bar Charts are used to summarise Nominal data Or Ordinal Data.
Unlike a histogram, Bar charts have vertical bars which do not overlap/ touch.
• X-axis Observations; Y-axis Frequency of Observation - 2o BoxPlot [aka : Box and Whisker PlotA method for summarising key features of a sample distribution using quantiles.
Box plots are particularly useful for indicating if a distribution is skewed and whether there are any outliers
Box plots are also useful for large samples sizes and comparing data sets.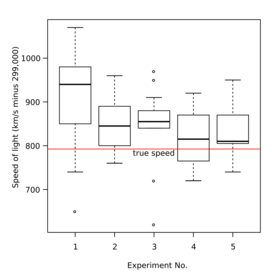
- 3o Categorical DataA set of data where the values or observations can be sorted according to category. For example Gender is categorical (male , female) , so is the shoe colour.
- 4o Continuous Variablea Variable which can theoretically take on any real value within a given interval.
Example: for the interval [-3,22] a discrete random variable can take on all values ,such as: 0.123 , 1.21728 , 21 , 15.2828 (…). - 5o Central TendencyA measure of central tendency is a statistic which attempts to indicate what the ‘center’, ‘average’ or ‘Typical’ value in a distribution is.
The three main measures of central tendency are: Mean, Mode, Median. - 6o Descriptive Statisticsone of the two main Braches of statistical analysis. Descriptive Statistics deals with Summarising the key features of the collected data, so that we can better understand the data. ( Statistical Analysis = Descriptive Statistics + Statistical inference )
- 7o Discrete Variablea Variable which can take on only Certain and specific values. Example: 1,2,3 (…) .
- 8o Frequency TableA way of summarizing a set of data. A Frequency table must display the whole sample distribution. It may also be enhanced with columns such as ‘Relative Frequency’.
Frequency Tables work for both discrete and continuous (but for continuous data we must first group the data into non overlapping intervals. Here is an example for a continues data set.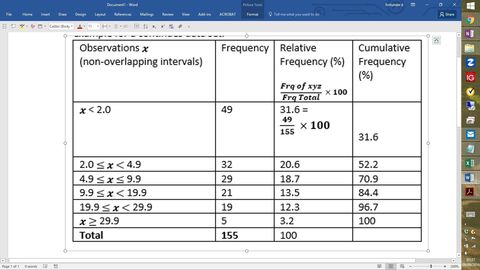
- 9o Histogram:A way of summarising a set of data. Histograms are only appropriate for variables whose values are numerical and measured on an interval scale. In general Histograms are used when dealing with large data sets (>100 observations).
A way of summarising a set of data. Histograms are only appropriate for variables whose values are numerical and measured on an interval scale. In general Histograms are used when dealing with large data sets (>100 observations).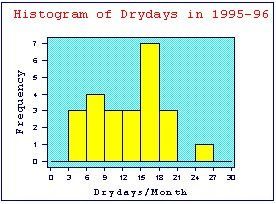
- 10o MedianMiddle value of an ordered data set. Below and above this Median observation there should be an equal number of observations.
Middle value of an ordered data set. Below and above this Median observation there should be an equal number of observations. - 11o ModeMost Frequently occurring value in a set of discrete data. Multi-modal data sets occur when there is more than one observation /value which qualifies as the mode.
- 12o Probability DistributionTable, equation or Graph which links: 1) Observed values and 2) the Frequency (number of occurrence) of the observed value.
- 13o Sampling Distributionthe probability distribution associated with a statistic, when a random sample is drawn from a population.
The Distribution consists of two parts : 1) Observed values in Sample + 2) Frequency (number of occurrence) of each observation. - 14o Skewnessthe degree of symmetry in the distribution of the sample data
- 15o Sample VarianceA measure of the spread (dispersion/ Variation) of a data set.
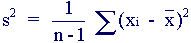
- 16o Standard DeviationA measure of the spread (dispersion/ Variation) of a data set.
The sample Standard Deviation is a more useful that the sample variance since it is measure in the same units X units rather than X2 units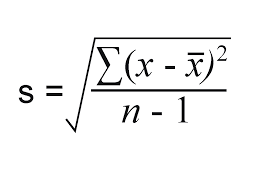
- 17o A Statisticknown function of our data. A statistic essentially summaries a key characteristic of some sample data using a single value. A Statistic can also be used to estimate the value of a population parameter.
- 18o Statistical InferenceOne of the two main braches of statistical analysis. Statistical inference involves using the observed sample data , to draw conclusions about the wider population.
( Statistical Analysis = Descriptive Statistics + Statistical inference ) - 19o Stem and Leaf Plot (For more Clear and concise detail refer to Hand Written Notes.)
- 20o VariableMeasurable Characteristic Or Quantity which can change from one entity to another.
- 21o Coefficient of Variation (CV)statistic which measures the spread of the data via the formula: CV= (Standard Deviation ) / (Sample Mean).
- 22o DispersionThe Variation between values. Data sets have dispersion as long as they are not all identical. A high value for dispersion (ie in Standard deviation) indicates that the values are widely scattered.
There are several measures of dispersion such as :
1) Standard deviation
2) Variance
3) Interquartile Range (IQR)
4) Mean Absolute difference (aka Gini mean absolute difference)
5) Median absolute deviation (MAD)
6) Average absolute deviation
7) Distance standard deviation. - 23o Nominal DataUnordered categories. Nominal data consists of observations which do not have any natural order, and where any assigned number / value is simply a label .
Example: marital status can be coded Y (Married) and N (single). Or gender could be coded 0 (female) 1 (male). - 24o Ordinal DataOrdered categories. Ordinal data sets consists of observations which can be ranked / put in order/ have a rating scale attached. You can count and Order, Ordinal Data.
Example: asking people to taste a variety of biscuits and rank each biscuit from 1-5 (where 5 indicates more enjoyment than 4…). - 25o Outlieran observation or value in a data set which is unusually small or large, when compared to other values.
Outliers must be examined carefully before embarking on any formal analysis. However outliers should NOT be removed routinely without further justification.
Outliers may be the result 1) Error or 2) Genuine extremity in the data. - 26o Pie ChartA method of summarising a set of Categorical data.
It is a circle divided into segments. Each segment represents a particular category. The area of each segment is proportional to the number of observations in that category.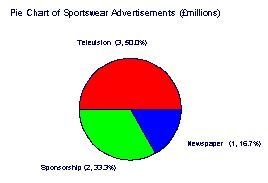
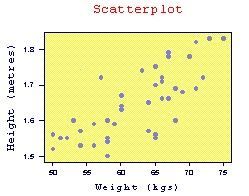
- 27o Scatter Plota useful method for summarizing a set of bivariate (two variable) data. Scatter plots are typically drawn before a linear regression line is drawn.
Informationen
- Beschreibung
- EC220 - Econometrics (Intro (Definitions EC113 Part 1)) Karteikarten am EC113 - Descriptive Statistics, erstellt von Fortunate Diamond am 09/09/2016.
- Erstellt von
- Fortunate Diamond
- Aufrufe
- 4
- Bewertung