
Mindmap
Population Indicators
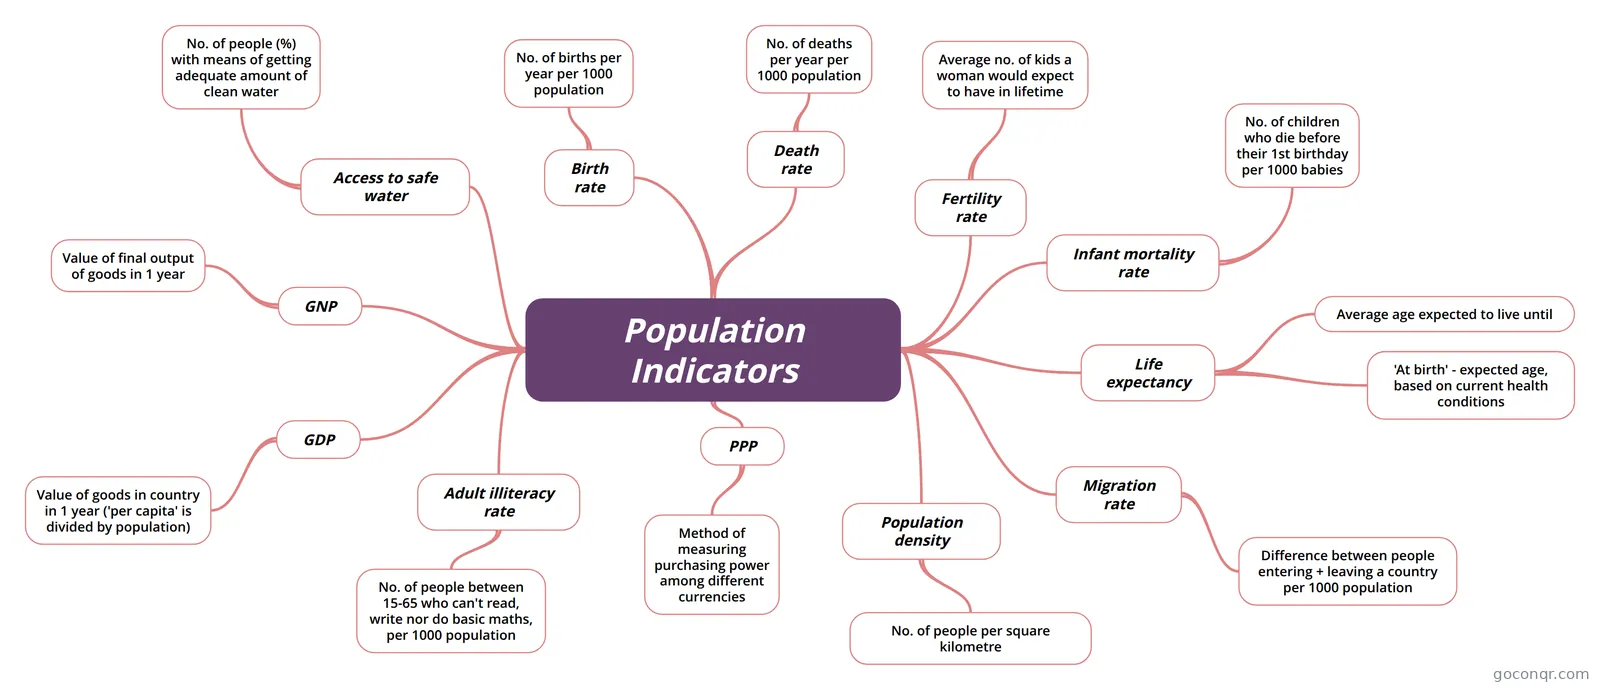
Mind map: population indicators
Inhalt der Mindmap
Population Indicators
Access to safe water
- No. of people (%) with means of getting adequate amount of clean water
Birth rate
- No. of births per year per 1000 population
Death rate
- No. of deaths per year per 1000 population
Fertility rate
- Average no. of kids a woman would expect to have in lifetime
Infant mortality rate
- No. of children who die before their 1st birthday per 1000 babies
Life expectancy
- Average age expected to live until
- 'At birth' - expected age, based on current health conditions
Migration rate
- Difference between people entering + leaving a country per 1000 population
Population density
- No. of people per square kilometre
Adult illiteracy rate
- No. of people between 15-65 who can't read, write nor do basic maths, per 1000 population
GDP
- Value of goods in country in 1 year ('per capita' is divided by population)
GNP
- Value of final output of goods in 1 year
PPP
- Method of measuring purchasing power among different currencies
Informationen
- Beschreibung
- Mindmap am Population Indicators, erstellt von Saskia Vince am 04/01/2015.
- Erstellt von
- Saskia Vince
- Aufrufe
- 18
- Bewertung
Mehr zu Population Data and Indicators