
Mindmap
Interval Estimation
Inhalt der Mindmap
Interval Estimation
inferential statistics
- A range of values within which, we believe, the true parameter lies with high probability
- This interval will be named a confidence interval
- A type of interval to estimate the true value of the population parameter, used to indicate the reliability of an estimate,
- It is an observed interval, different from sample to sample, which potentially includes the unobservable true parameter of population
- Confidence Level
- The confidence level is the frequency (i.e., the proportion) of possible confidence intervals that contain the true value of the corresponding parameter.
- How frequently the observed interval contains the parameter if the experiment is repeated, is called the confidence level
- if confidence intervals are constructed using a given confidence level in an infinite number of independent experiments, the proportion of those intervals that contain the true value of the parameter will match the confidence level
- Gives us the success rate of the procedure used to construct the confidence interval.
- Confidence interval
- The confidence interval is different from random sample to sample, which is therefore also random.
- Be careful to interpret confidence intervals correctly
- Example: 0.456 < p < 0.954 at 95% confidence level
- Correct: We are 95% confident that the interval from 0.456 to 0.954 actually does contain the true value of p
- Incorrect: There is a 95% chance that the true value of p will fall between 0.456 and 0.954
- Example: 0.456 < p < 0.954 at 95% confidence level
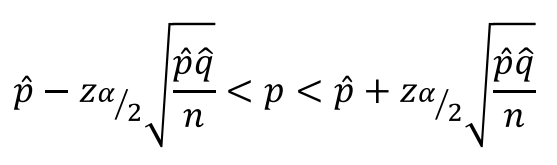
- Constructing a Confidence Interval
- 1. Verify basic requirements are satisfied (see previous definition)
- 2. Find the critical value zα/2 from the z tables that corresponds to the desired confidence leve
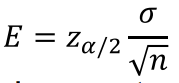
- 3. Evaluate the margin of error using formula for E
- 4. Find the values of:
- 3. Evaluate the margin of error using formula for E
- 2. Find the critical value zα/2 from the z tables that corresponds to the desired confidence leve
- 1. Verify basic requirements are satisfied (see previous definition)
- Confidence interval
- The confidence level is a kind of probability.
- A confidence level is always represented as 1- a
- a is called the significance level (is the rejecting probability of the study)
Point estimation
- an estimate based on only a single random sample, expected to vary from sample to sample for example, the mean of some quantity.
Estimating a Population Proportion
- A proportion is a statistic/parameter of a sample/population containing binomial measurement data
- Requirements
- The sample is a simple random sample
- Binomial distribution conditions are satisfied
- There are at least 5 successes and 5 failures
- This condition ensures that np ≥ 5 and nq ≥ 5
- Notations
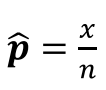
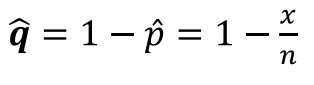
- Considering a sample of size n consistent with binomial distribution, where the number of success is x.
- Sample proportion of success
- Sample proportion of failure
- Population proportion of success: P
- Assumption
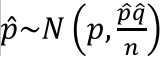
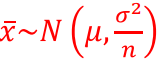
- when n is large enough, the sample proportion of success is in a normal distribution
- Considering a sample of size n consistent with binomial distribution, where the number of success is x.
Estimating a Population Mean
- Requirements
- Sample is a simple random sample
- Either n > 30, or the population is normally distributed
- Standard deviation for the population is known
- Notations:
- μ = population mean
- σ = population standard deviation (known)
- x̄ = sample mean
- n = sample size
- Confidence Interval for Estimating a Population Mean (with σ known)
- Margin error
- Assumptions
- When n is large enough, the sample mean is assumed to be consistent with a normal distribution
- σ not known
- If we do not know the value of the population’s Standard deviation σ. We need to use Student’s t-distribution instead of the normal distribution that we used as an assumption for interval estimation
- We do not know the standard deviation of the population, so we estimate it with the value of the sample standard deviation s,
- This introduces another source of unreliability
- In order to maintain a desired confidence level, we compensate for this additional unreliability by making the confidence interval wider.
- This introduces another source of unreliability
- Requirements
Student t-Distribution
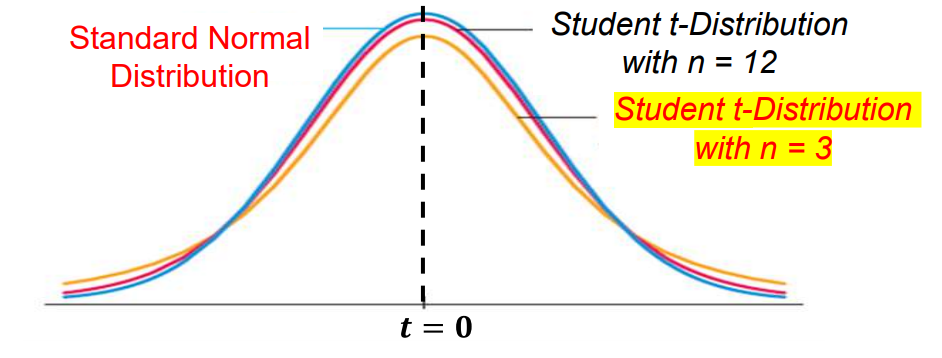
- If a population has a normal distribution, the distribution of all samples of size n collected from the population forms:
- Properties of the t-Distribution
- 1. It is different for different sample sizes
- 2. Same general bell shape as the standard normal distribution, but it reflects the greater variability that is expected with small samples
- 3. It has a mean of t = 0
- 4. The standard deviation of the Student tdistribution varies with the sample size, but it is greater than 1
- 5. As the sample size n gets larger, the Student t-distribution gets closer to the standard normal distribution
- Interval estimation of population mean when σ is unknown
- Step 1: Check requirements (For estimating population mean)
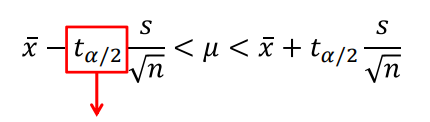
- Step 2: Confidence interval
- We use ta/2 as the critical value, because we assume that the sample mean is consistent with a Student t-distribution around the population mean
- Step 2: Confidence interval
- Step 1: Check requirements (For estimating population mean)
- t-Table
- In order to facilitate the interval estimation, mathematicians and statistics pioneers developed a t-table which lists the corresponding critical values against the significance level and the degree of freedom of sample used for estimation
- Confidence level: 1- a
- Significance level: a
- Degree of freedom: n - 1 (n is sample size)
- t-tables are used to provide a t-score
- Degrees of Freedom is given in the left-hand column
- the body of the table tests the level of significance for either onetailed test or two-tailed test
- Degrees of Freedom
- The degrees of freedom for a collection of sample data is the number of sample values that can vary after certain restrictions have been imposed on all data values.
- Often abbreviated as df
- where df = n - 1
- The degrees of freedom for a collection of sample data is the number of sample values that can vary after certain restrictions have been imposed on all data values.
Estimating a Population Variance
- Chi-Square Distribution
- The following sample statistic has a sampling distribution called the chi-square distribution
- where n is the sample size; s2 is the sample variance; and (sigma)2 is the population variance
- It is not symmetric, unlike the normal and Student t-distributions
- 2. Values of chi-square can be positive or zero, but not negative,
- 3. It is different for each number of degrees of freedom
- Because chi-square is not symmetric, we cannot apply a confidence interval formula of s2 ± E
- We must do separate calculations for the upper and lower confidence interval limits
- Notation
- σ2 is the population variance
- s2 is the sample variance
- χ2 L is the left-tail critical value of χ2
- χ2 R is the right-tail critical value of χ2
- Chi-square Distribution Table
- Critical values of the chi-square distribution are contained in chi-square tables,
- Degrees of freedom, as with the Student t-Distribution, degrees of freedom is n-1
- How to use Chi-square Distribution Table
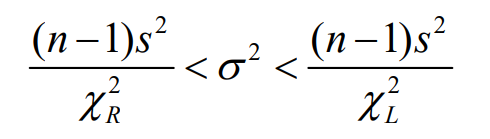
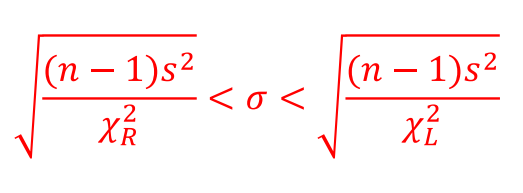
- Constructing a confidence interval for σ2
- Verify that the requirements are satisfied
- Sample is simply random sample
- Population is normally distributed
- Using n – 1 degrees of freedom, refer to the chi-square tables and find the critical values χR 2 and χL 2 that corresponds to the desired confidence level
- Evaluate the upper/lower confidence interval limits using this format:
- Verify that the requirements are satisfied
- The following sample statistic has a sampling distribution called the chi-square distribution
- Chi-Square Distribution
Bilder und Dateien der Mindmap


Informationen
- Beschreibung
- Mindmap am Interval Estimation, erstellt von Henry Yannaghas am 08/01/2020.
- Erstellt von
- Henry Yannaghas · Jan 2020
- Aktualisiert
- 8 Jan 2020
- Aufrufe
- 0
- Bewertung