
Mindmap
Chapter 7: Investigating Data
Inhalt der Mindmap
Chapter 7: Investigating Data
Mean and mode
- mean = sum of scores/ number of score
- Mode=most frequent score
Organising and displaying data
- Graphs
- Column
- Secto
- Tables
- Charts
- Pie chart
- Graphs
Types of Data
- Categorical
- Groups in categories
- Numerical
- Numbers
- Discrete
- distinct values
- Contiuous
- not exact
- decimal points
- not exact
- Categorical
Median and range
- median= middle score( in order)
- range= highest score- lowest score
Analysing frequency tables
- fx colum= score x frequency
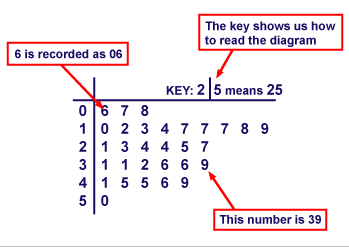
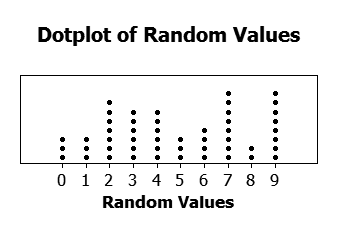
Dot plots and Stem and leaf plots
- Dot plots show cluster and outliers
- Stem and lea plots show modes, clusters and how the scores are spread out
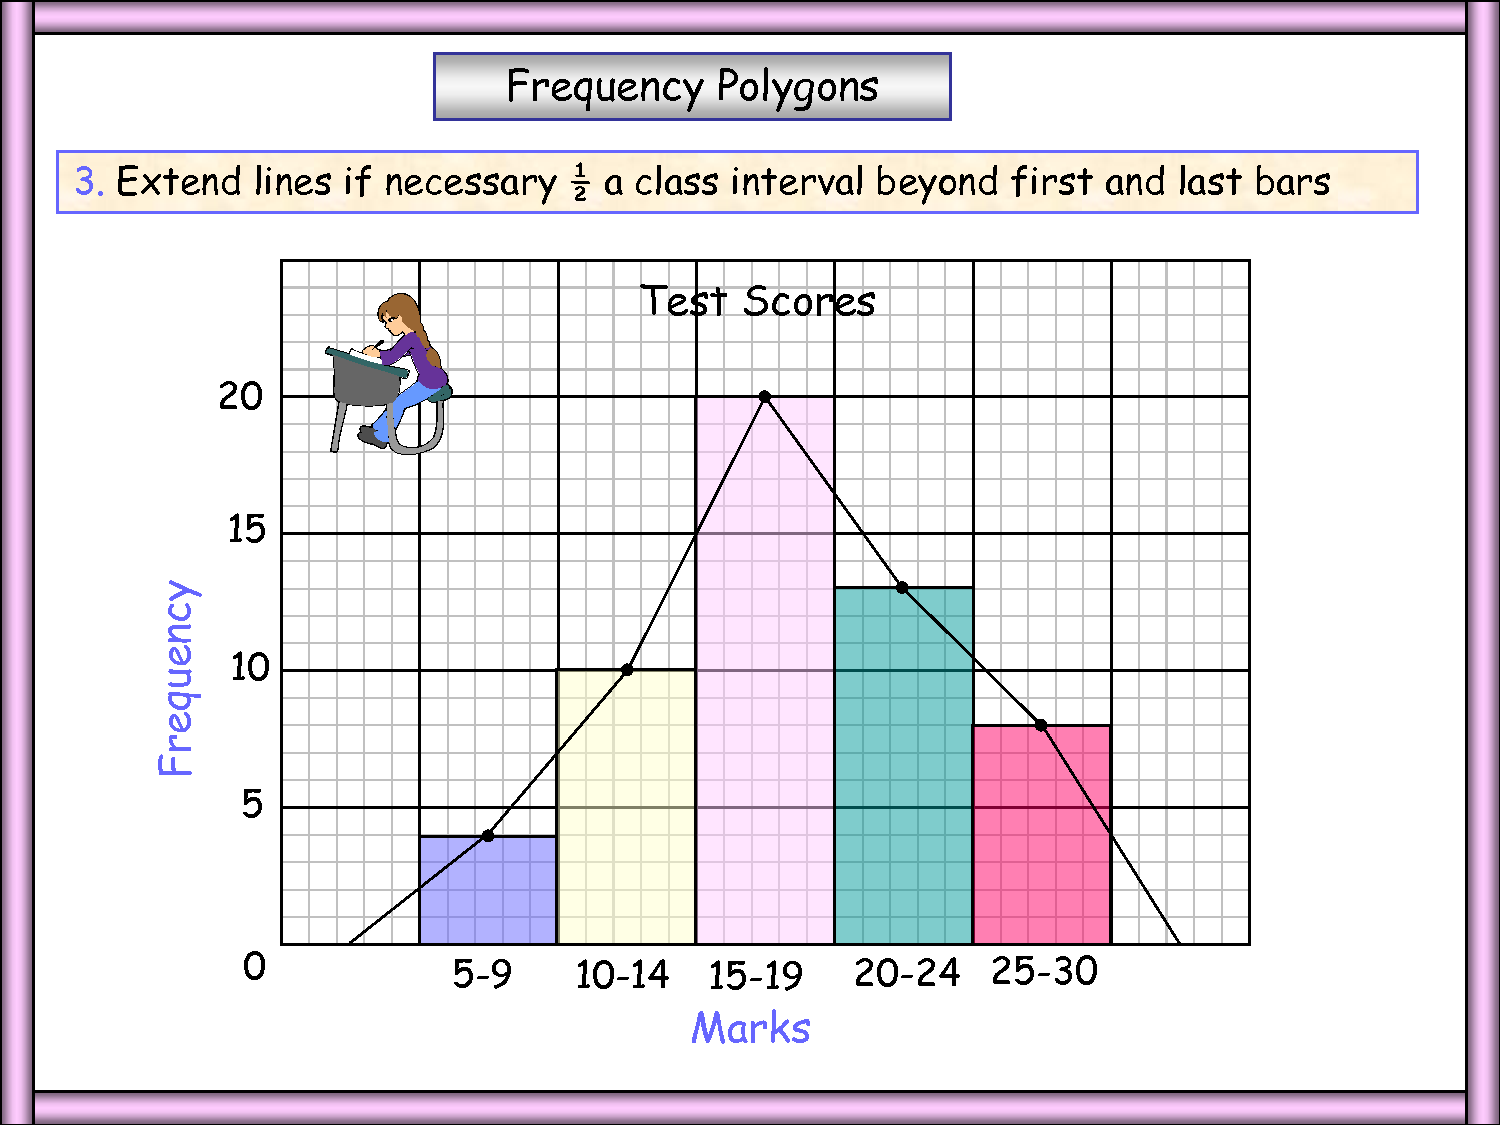
Frequency histograms and ploygons
Sampling
- Sample
- selection of people
- Census
- whole population
- random sample
- NOT biased
- =not opiniated questions
- NOT biased
- Sample
Designing survey questions
- simple
- not biased
- easy to answer
- not too long
Analysing data
- Mean
- affected by outliers
- *best when no outliers
- Mode
- not affected by outliers
- *best when most common score is needed
- Median
- not affected by outliers
- *when data has outliers
- Range
- *when a measure of spread is needed
- Mean
Bilder und Dateien der Mindmap
Informationen
- Beschreibung
- 8 Maths Mindmap am Chapter 7: Investigating Data, erstellt von Sarah L am 27/07/2015.
- Erstellt von
- Sarah L · Jul 2015
- Aktualisiert
- 18 Nov 2016
- Aufrufe
- 258
- Bewertung