1351734
Description
Flashcards by Culan O'Meara, updated more than 1 year ago
|
|
Created by Culan O'Meara
about 11 years ago
|
|
| Question | Answer |
| Mean | Mean is a measure of central tendency. Sum of numbers/total number of numbers |
| Mode | Mode is a measure of central tendency. Most common number |
| Median | Median is a measure of central tendency. Middle number |
| Central Tendency | Gives an indication of the "middle" of a set of data. it is measured using the mean, median and mode. Each of these is calculated differently and the one that is best to use depends on the data you have |
| Range | Range = Largest - smallest |
| Interquartile range | Upper quartile - lower quartile. |
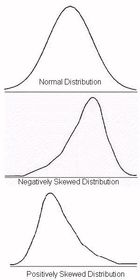
| Shape of distribution | Shape refers to whether a data is normally distributed, skewed left/negatively or skewed right/positively |
| Outlier | A value that "lies outside" (is much smaller or larger than) most of the other values in a set of data. For example in the scores 25,29,3,32,85,33,27,28 both 3 and 85 are "outliers". |
| Primary v Secondary Data | Primary data is data you collect yourself through survey/experiment/investigation. Secondary data is data you find through a newspaper/website/etc. Basically data that someone else has collected |
| Categorical v Numerical | Categorical data is non-numerical data and can be ordered or nominal Numerical data has numbers and can be discrete or continuous |
| Bias | Bias occurs when the survey sample does not accurately represent the population. The bias that results from an unrepresentative sample is called selection bias |
| Simple Random Sample | Random sampling is a procedure for sampling from a population in which: (a) the selection of a sample unit is based on chance (b) every element of the population has an equal chance of being selected. |
| Representativeness | It is the closeness of the sample to the population from which the sample has been taken |
| Population | A population is any entire collection of people, animals, plants or things from which we may collect data. It is the entire group we are interested in, which we wish to describe or draw conclusions about. |
| Sample | A sample is a group of units selected from a larger group (the population). |
| Parameter | A parameter is a value, usually unknown (and which therefore has to be estimated), used to represent a certain population characteristic |
| Statistic | A statistic is a quantity that is calculated from a sample of data. |
| Census | Collection of data from a whole population rather than just a sample |
| Sampling Variability | Difference (or variance) between sample statistics from different samples. Example: If I ask 10 people their height and find the mean height of those, it may well be different to the mean height of another 10 people I ask. This difference is sampling variability |
Want to create your own Flashcards for free with GoConqr? Learn more.