
Mindmap
BIVARIANT STATISTICAL MEASURES
Inhalt der Mindmap
BIVARIANT STATISTICAL MEASURES
CORRELATION
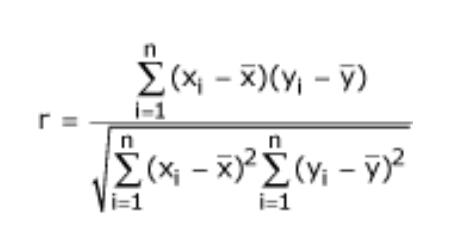
- It is sometimes called Pearson’s correlation coefficient after its originator and is a measure of linear association.
- The correlation coefficient is measured on a scale that varies from + 1 through 0 to – 1. Complete correlation between two variables is expressed by either + 1 or -1. When one variable increases as the other increases the correlation is positive; when one decreases as the other increases it is negative.
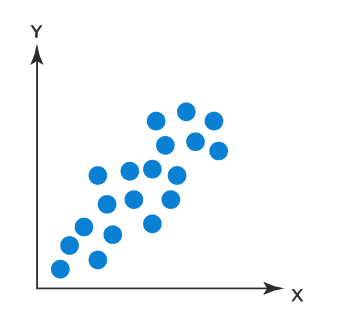
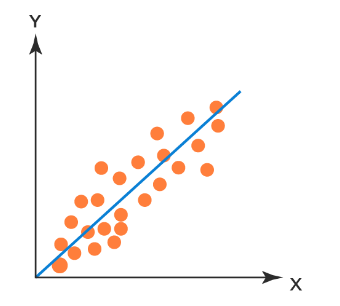
- On a scatter diagram, the closer the points lie to a straight line, the stronger the linear relationship between two variables. To quantify the strength of the relationship, we can calculate the correlation coefficient.
- The correlation coefficient is given by the following equation; where "X", is the mean of the x values, and "Y" is the mean of the y values
- The correlation coefficient is given by the following equation; where "X", is the mean of the x values, and "Y" is the mean of the y values
- CORRELATION´S MISUSE
- One of the most common errors in interpreting the correlation coefficient is failure to consider that there may be a third variable related to both of the variables being investigated, which is responsible for the apparent correlation.
- Another situation in which a correlation coefficient is sometimes misinterpreted is when comparing two methods of measurement. A high correlation can be incorrectly taken to mean that there is agreement between the two methods.
- It is sometimes called Pearson’s correlation coefficient after its originator and is a measure of linear association.
REGRESSION
- It refers to assessing the relationship between the outcome variable and one or more variables.
- The outcome variable is known as the dependent or response variable and the risk elements, and co-founders are known as predictors or independent variables. The dependent variable is shown by “y” and independent variables are shown by “x” in regression analysis.
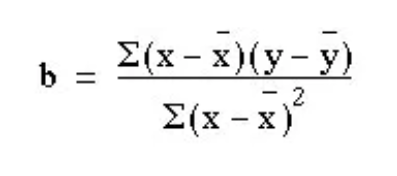
- The regression line is obtained using the method of least squares.
- The regression equation is often more useful than the correlation coefficient. It enables us to predict y from x and gives us a better summary of the relationship between the two variables. If, for a particular value of x, x i, the regression equation predicts a value of y fit , the prediction error is .
- Regression analysis is used to determine the relationship between two variables such that the value of the unknown variable can be estimated using the knowledge of the known variables. The goal of linear regression is to find the best-fitted line through the data points.
- The regression line is obtained using the method of least squares.
- Regression lines give us useful information about the data are collected from. It shows how one variable changes on average with another, and it can be used to find out what one variable is likely to be when we know the other provided that we ask this question within the limits of a scatter diagram.
- The outcome variable is known as the dependent or response variable and the risk elements, and co-founders are known as predictors or independent variables. The dependent variable is shown by “y” and independent variables are shown by “x” in regression analysis.
- It refers to assessing the relationship between the outcome variable and one or more variables.
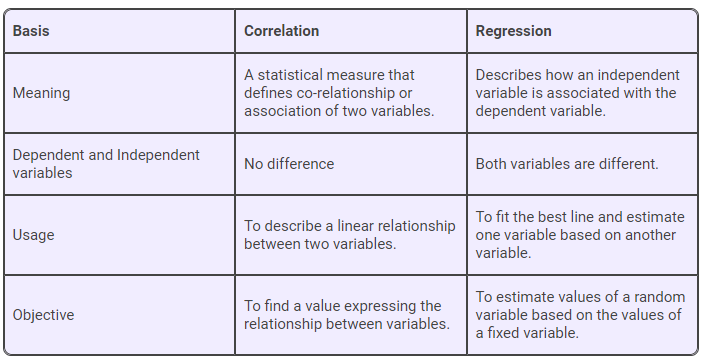
Finally, differences between REGRESSION AND CORRELATION are:
Bilder und Dateien der Mindmap
Informationen
- Beschreibung
- Mindmap am BIVARIANT STATISTICAL MEASURES, erstellt von Hidalia Morales am 20/09/2022.
- Erstellt von
- Hidalia Morales · Sep 2022
- Aktualisiert
- 10 Mai 2023
- Aufrufe
- 6
- Bewertung