
Mindmap
STATISTICAL MEASURES REGRESSION BIVARIATES AND CORRELATION
Inhalt der Mindmap
STATISTICAL MEASURES REGRESSION BIVARIATES AND CORRELATION
SCATTER DIAGRAM: It is a tool that helps to identify the possible relationship between two variables. Represents the relationship between two variables graphical form, which makes it easier to visualize and interpret the data.
REGRESSION: is an analysis technique that calculates the estimated relationship between a dependent variable and one or several explanatory variables. with analysis regression, it is possible to model the relationship between the chosen variables, as well How to predict values based on the model.
- Simple linear regression model: it is the most used, is a way that allows modeling a relationship between two sets of variables. The result is a equation that can be used to make projections or estimates on the data EQUATION
- E(Y/x) = 0 + β1 x
- Multiple linear regression model This method allows to identify which are the variables independent are those that can explain a independent variable, check the causes and roughly predict the values EQUATION
- Y = 0 + β1X1 + β2X2 + … + βnXn + ε
- Nonlinear Regression Model Nonlinear regression is a more complicated process where it can occur than in the number of parameters does not match the number of variables explanatory. An example of a nonlinear model in the parameters would be given by the following exponent functionl:
- Υ= αΧβ On many occasions you can transform the original variables to convert the nonlinear function into a linear one and so, apply these techniques. Therefore, if the not linearity affects only variables explanatory but not to the coefficients, You can define new variables.
- Nonlinear Regression Model Nonlinear regression is a more complicated process where it can occur than in the number of parameters does not match the number of variables explanatory. An example of a nonlinear model in the parameters would be given by the following exponent functionl:
- Y = 0 + β1X1 + β2X2 + … + βnXn + ε
- Multiple linear regression model This method allows to identify which are the variables independent are those that can explain a independent variable, check the causes and roughly predict the values EQUATION
- E(Y/x) = 0 + β1 x
- Simple linear regression model: it is the most used, is a way that allows modeling a relationship between two sets of variables. The result is a equation that can be used to make projections or estimates on the data EQUATION
CORRELATION: is a statistical measure that expresses to what extent two variables are related linearly (that is, they change together at a constant rate).
- TYPES OF CORRELATION
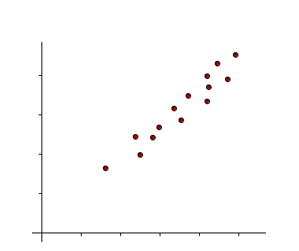
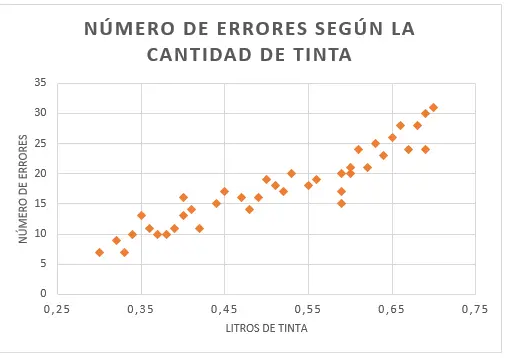
- DIRECT CORRELATION: The direct correlation occurs when increasing one of the variables the other increases The line corresponding to the point cloud of the distribution is a line growing
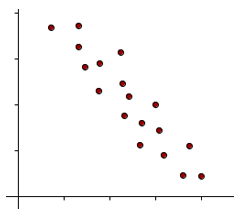
- INVERSE CORRELATION: The correlation The inverse occurs when increasing one of the variables the other decreases. the straight corresponding to the cloud of points of the distribution is a decreasing line.
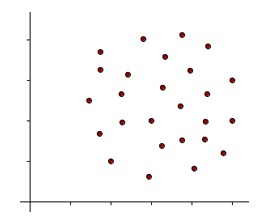
- NULL CORRELATION The null correlation is given when there is no dependency of any kind between variables. In this case it says that the variables are uncorrelated and the cloud of dots have a shape rounded.
- COEFFICIENT OF CORRELATION s the measure that quantifies the intensity of the linear relationship between two variables in an analysis of correlation.
- INTERPRETATION Pearson's r expresses in which degree subjects have the same order on two variables. Yes the taller subjects weigh more and the shorter ones weigh less, between weight and height we will have a correlation positive: the greater the height, the greater the weight.
- FORMULAS The Pearson correlation coefficient when applied to a population is typically represented by the Greek letter (rho) and refers to it population correlation coefficient or the Pearson's population correlation coefficient.
- INTERPRETATION Pearson's r expresses in which degree subjects have the same order on two variables. Yes the taller subjects weigh more and the shorter ones weigh less, between weight and height we will have a correlation positive: the greater the height, the greater the weight.
- TYPES OF CORRELATION
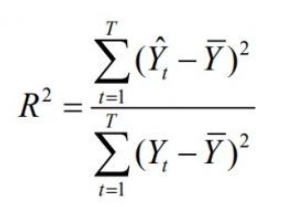
COEFFICIENT OF DETERMINATION is the proportion of total variance of the variable explained by the regression. It is also called R squared and serves to reflect kindness the fit of a model to the target variable explain.
- What does the R2 indicate? The R-squared is a statistical measure of how close are the data from the fitted regression line. I also know known as the coefficient of determination, or coefficient of multiple determination if it is multiple regression.
Bilder und Dateien der Mindmap

Informationen
- Beschreibung
- Mindmap am STATISTICAL MEASURES REGRESSION BIVARIATES AND CORRELATION, erstellt von Monica Blanco Vasquez am 14/11/2022.
- Erstellt von
- Monica Blanco Vasquez
- Aufrufe
- 5
- Bewertung