
Mindmap
Quality Tools
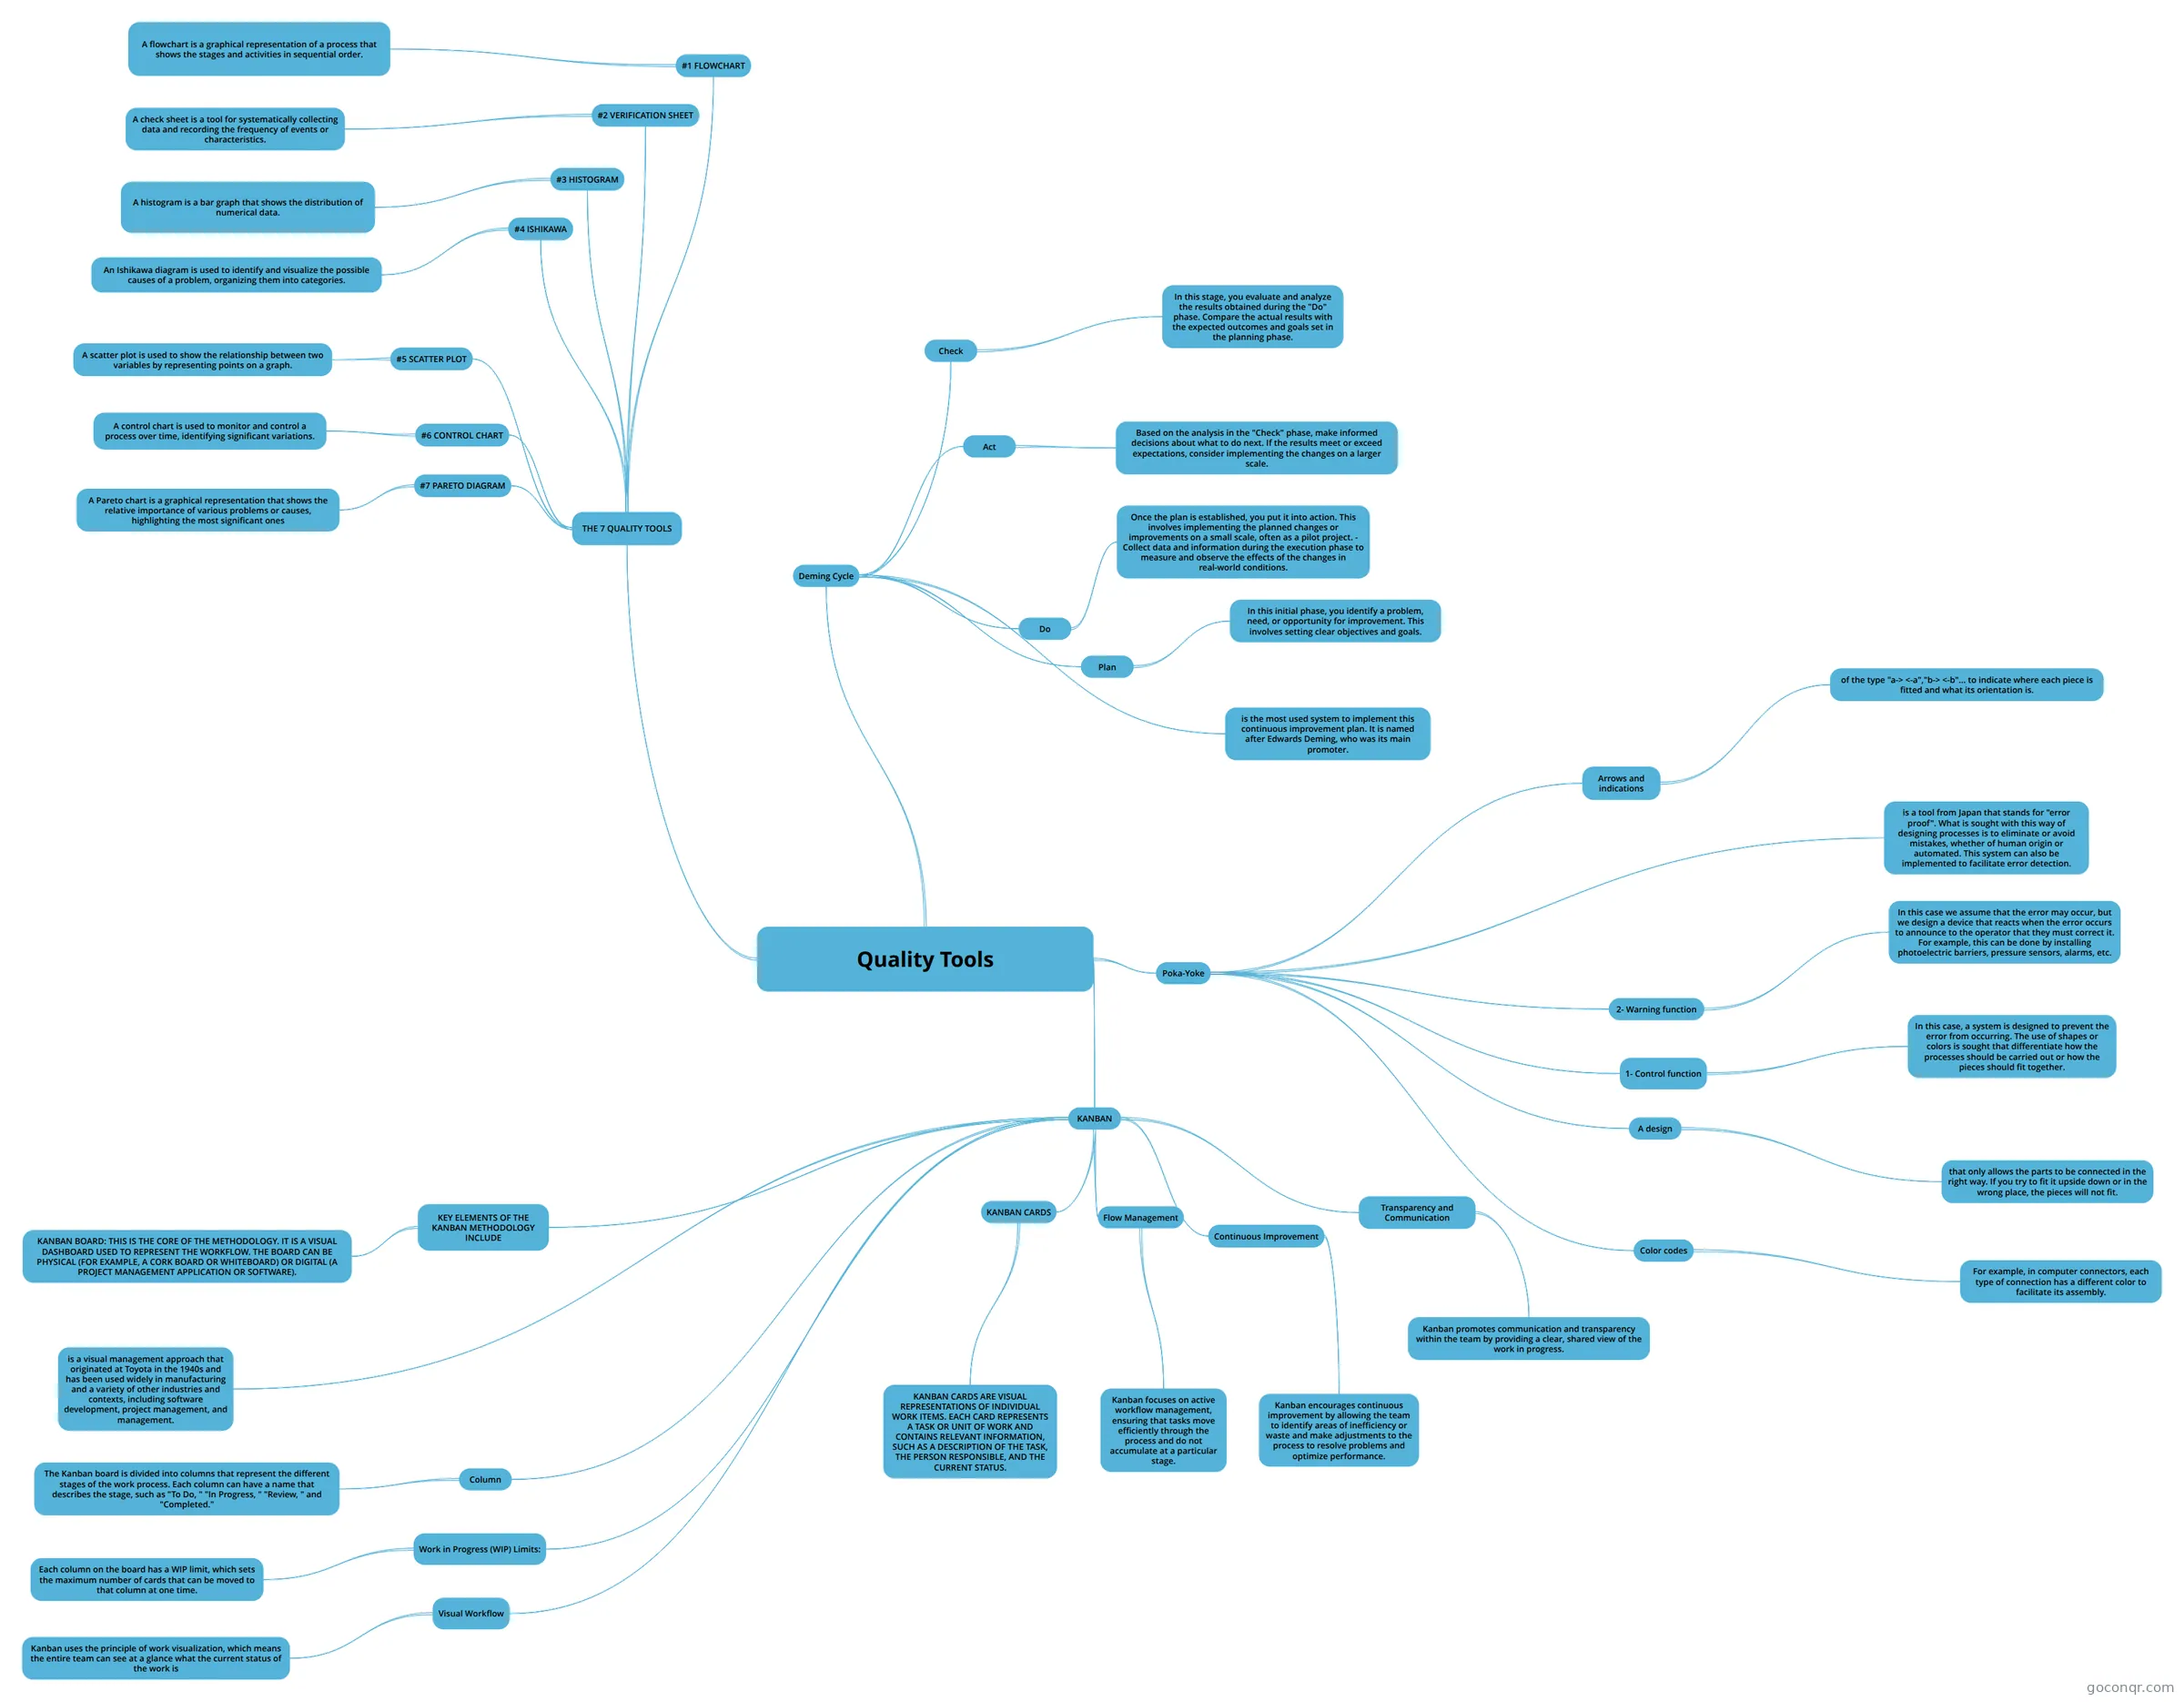
Mind map: Quality tools
Inhalt der Mindmap
Quality Tools
Deming Cycle
- is the most used system to implement this continuous improvement plan. It is named after Edwards Deming, who was its main promoter.
- Plan
- In this initial phase, you identify a problem, need, or opportunity for improvement. This involves setting clear objectives and goals.
- Do
- Once the plan is established, you put it into action. This involves implementing the planned changes or improvements on a small scale, often as a pilot project. - Collect data and information during the execution phase to measure and observe the effects of the changes in real-world conditions.
- Check
- In this stage, you evaluate and analyze the results obtained during the "Do" phase. Compare the actual results with the expected outcomes and goals set in the planning phase.
- Act
- Based on the analysis in the "Check" phase, make informed decisions about what to do next. If the results meet or exceed expectations, consider implementing the changes on a larger scale.
Poka-Yoke
- is a tool from Japan that stands for "error proof". What is sought with this way of designing processes is to eliminate or avoid mistakes, whether of human origin or automated. This system can also be implemented to facilitate error detection.
- 1- Control function
- In this case, a system is designed to prevent the error from occurring. The use of shapes or colors is sought that differentiate how the processes should be carried out or how the pieces should fit together.
- 2- Warning function
- In this case we assume that the error may occur, but we design a device that reacts when the error occurs to announce to the operator that they must correct it. For example, this can be done by installing photoelectric barriers, pressure sensors, alarms, etc.
- A design
- that only allows the parts to be connected in the right way. If you try to fit it upside down or in the wrong place, the pieces will not fit.
- Color codes
- For example, in computer connectors, each type of connection has a different color to facilitate its assembly.
- Arrows and indications
- of the type "a-> <-a","b-> <-b"... to indicate where each piece is fitted and what its orientation is.
KANBAN
- is a visual management approach that originated at Toyota in the 1940s and has been used widely in manufacturing and a variety of other industries and contexts, including software development, project management, and management.
- KEY ELEMENTS OF THE KANBAN METHODOLOGY INCLUDE
- KANBAN BOARD: THIS IS THE CORE OF THE METHODOLOGY. IT IS A VISUAL DASHBOARD USED TO REPRESENT THE WORKFLOW. THE BOARD CAN BE PHYSICAL (FOR EXAMPLE, A CORK BOARD OR WHITEBOARD) OR DIGITAL (A PROJECT MANAGEMENT APPLICATION OR SOFTWARE).
- KANBAN CARDS
- KANBAN CARDS ARE VISUAL REPRESENTATIONS OF INDIVIDUAL WORK ITEMS. EACH CARD REPRESENTS A TASK OR UNIT OF WORK AND CONTAINS RELEVANT INFORMATION, SUCH AS A DESCRIPTION OF THE TASK, THE PERSON RESPONSIBLE, AND THE CURRENT STATUS.
- Column
- The Kanban board is divided into columns that represent the different stages of the work process. Each column can have a name that describes the stage, such as "To Do, " "In Progress, " "Review, " and "Completed."
- Work in Progress (WIP) Limits:
- Each column on the board has a WIP limit, which sets the maximum number of cards that can be moved to that column at one time.
- Visual Workflow
- Kanban uses the principle of work visualization, which means the entire team can see at a glance what the current status of the work is
- Flow Management
- Kanban focuses on active workflow management, ensuring that tasks move efficiently through the process and do not accumulate at a particular stage.
- Continuous Improvement
- Kanban encourages continuous improvement by allowing the team to identify areas of inefficiency or waste and make adjustments to the process to resolve problems and optimize performance.
- Transparency and Communication
- Kanban promotes communication and transparency within the team by providing a clear, shared view of the work in progress.
THE 7 QUALITY TOOLS
- #1 FLOWCHART
- A flowchart is a graphical representation of a process that shows the stages and activities in sequential order.
- #2 VERIFICATION SHEET
- A check sheet is a tool for systematically collecting data and recording the frequency of events or characteristics.
- #3 HISTOGRAM
- A histogram is a bar graph that shows the distribution of numerical data.
- #4 ISHIKAWA
- An Ishikawa diagram is used to identify and visualize the possible causes of a problem, organizing them into categories.
- #5 SCATTER PLOT
- A scatter plot is used to show the relationship between two variables by representing points on a graph.
- #6 CONTROL CHART
- A control chart is used to monitor and control a process over time, identifying significant variations.
- #7 PARETO DIAGRAM
- A Pareto chart is a graphical representation that shows the relative importance of various problems or causes, highlighting the most significant ones
- #1 FLOWCHART
Informationen
- Beschreibung
- Mindmap am Quality Tools, erstellt von GUSTAVO MORALES SAUCEDO am 26/01/2023.
- Erstellt von
- GUSTAVO MORALES SAUCEDO
- Aufrufe
- 8
- Bewertung
Mehr zu Quality Tools and Techniques