
Mindmap
Bivariate statistical measures
Inhalt der Mindmap
Bivariate statistical measures
Correlation
- When it comes to correlation, think of it as the combination of the words “co” meaning together, and “relation” meaning a connection between two quantities. In this sense, correlation is when a change follows a change to one variable in another, whether direct or indirect. Variables are believed to be “uncorrelated” when a change in one does not affect the other. In short, it measures the relationship between two variables.
- Correlation analysis
- The main purpose of correlation, through the lens of correlation analysis, is to allow experimenters to know the association or the absence of a relationship between two variables. When these variables are correlated, you’ll be able to measure the strength of their association.
- One key benefit of correlation is that it is a more concise and clear summary of the relationship between the two variables than you’ll find with regression.
- Example of correlation
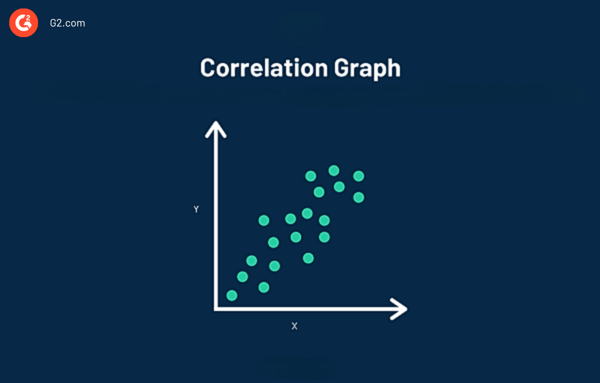
- A correlation chart, also known as a scatter diagram, makes it easier to see the correlation between two variables visually. Data in a correlation chart is represented by a single point. In the chart above, you can observe that correlation plots various points of single data.
- Example of correlation
- One key benefit of correlation is that it is a more concise and clear summary of the relationship between the two variables than you’ll find with regression.
- The main purpose of correlation, through the lens of correlation analysis, is to allow experimenters to know the association or the absence of a relationship between two variables. When these variables are correlated, you’ll be able to measure the strength of their association.
- Correlation analysis
- When it comes to correlation, think of it as the combination of the words “co” meaning together, and “relation” meaning a connection between two quantities. In this sense, correlation is when a change follows a change to one variable in another, whether direct or indirect. Variables are believed to be “uncorrelated” when a change in one does not affect the other. In short, it measures the relationship between two variables.
Regression
- On the other hand, regression is how one variable affects another or changes in a variable that trigger changes in another, essentially cause and effect. It implies that the outcome is dependent on one or more variables.
- Regression analysis
- Regression analysis helps to determine the functional relationship between two variables (x and y) so that you’re able to estimate the unknown variable to make future projections on events and goals. The main objective of regression analysis is to estimate the values of a random variable (z) based on the values of your known (or fixed) variables (x and y). Linear regression analysis is considered to be the best-fitting line through the data points.
- Example of regression
- When it comes to using regression, we at G2 utilize regression to predict certain trends, like how our traffic is expected to grow over the coming months. One person in particular who uses regression is an SEO and Data Analyst. Being able to visualize data, analyze it, see trends, and predict what the data could look like in the future is a big part of their job. Many teams rely on their work to set team goals and to understand how our traffic could look in the future.
- Example of regression
- Regression analysis helps to determine the functional relationship between two variables (x and y) so that you’re able to estimate the unknown variable to make future projections on events and goals. The main objective of regression analysis is to estimate the values of a random variable (z) based on the values of your known (or fixed) variables (x and y). Linear regression analysis is considered to be the best-fitting line through the data points.
- Regression analysis
- On the other hand, regression is how one variable affects another or changes in a variable that trigger changes in another, essentially cause and effect. It implies that the outcome is dependent on one or more variables.
Bilder und Dateien der Mindmap
Informationen
- Beschreibung
- Mindmap am Bivariate statistical measures, erstellt von Carolina Arias am 14/05/2023.
- Erstellt von
- Carolina Arias
- Aufrufe
- 0
- Bewertung