
Mindmap
QUALITY TOOLS
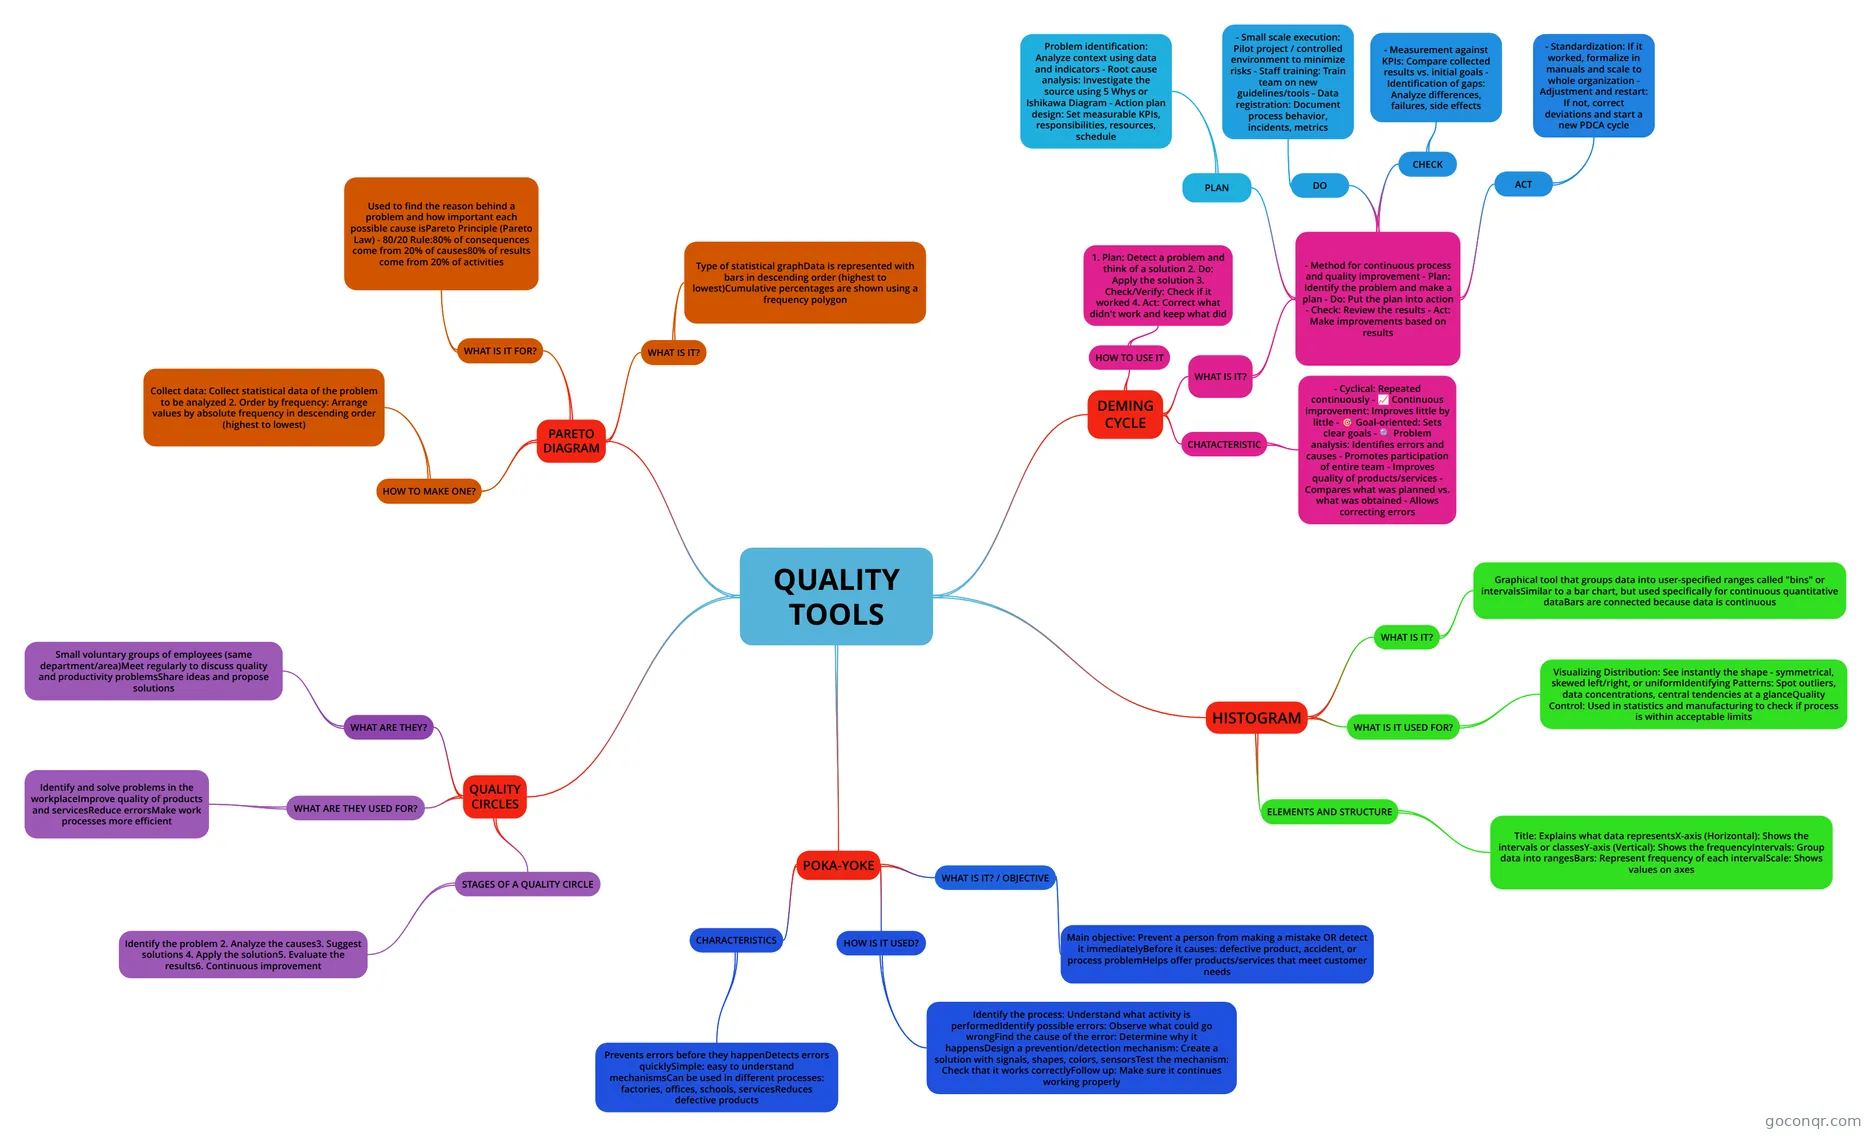
Mind map: Quality tools
Inhalt der Mindmap
QUALITY TOOLS
HISTOGRAM
- WHAT IS IT?
- Graphical tool that groups data into user-specified ranges called "bins" or intervalsSimilar to a bar chart, but used specifically for continuous quantitative dataBars are connected because data is continuous
- WHAT IS IT USED FOR?
- Visualizing Distribution: See instantly the shape - symmetrical, skewed left/right, or uniformIdentifying Patterns: Spot outliers, data concentrations, central tendencies at a glanceQuality Control: Used in statistics and manufacturing to check if process is within acceptable limits
- ELEMENTS AND STRUCTURE
- Title: Explains what data representsX-axis (Horizontal): Shows the intervals or classesY-axis (Vertical): Shows the frequencyIntervals: Group data into rangesBars: Represent frequency of each intervalScale: Shows values on axes
- WHAT IS IT?
QUALITY CIRCLES
- WHAT ARE THEY?
- Small voluntary groups of employees (same department/area)Meet regularly to discuss quality and productivity problemsShare ideas and propose solutions
- WHAT ARE THEY USED FOR?
- Identify and solve problems in the workplaceImprove quality of products and servicesReduce errorsMake work processes more efficient
- STAGES OF A QUALITY CIRCLE
- Identify the problem 2. Analyze the causes3. Suggest solutions 4. Apply the solution5. Evaluate the results6. Continuous improvement
- WHAT ARE THEY?
DEMING CYCLE
- WHAT IS IT?
- - Method for continuous process and quality improvement - Plan: Identify the problem and make a plan - Do: Put the plan into action - Check: Review the results - Act: Make improvements based on results
- PLAN
- Problem identification: Analyze context using data and indicators - Root cause analysis: Investigate the source using 5 Whys or Ishikawa Diagram - Action plan design: Set measurable KPIs, responsibilities, resources, schedule
- DO
- - Small scale execution: Pilot project / controlled environment to minimize risks - Staff training: Train team on new guidelines/tools - Data registration: Document process behavior, incidents, metrics
- CHECK
- - Measurement against KPIs: Compare collected results vs. initial goals - Identification of gaps: Analyze differences, failures, side effects
- ACT
- - Standardization: If it worked, formalize in manuals and scale to whole organization - Adjustment and restart: If not, correct deviations and start a new PDCA cycle
- PLAN
- - Method for continuous process and quality improvement - Plan: Identify the problem and make a plan - Do: Put the plan into action - Check: Review the results - Act: Make improvements based on results
- CHATACTERISTIC
- - Cyclical: Repeated continuously - 📈 Continuous improvement: Improves little by little - 🎯 Goal-oriented: Sets clear goals - 🔍 Problem analysis: Identifies errors and causes - Promotes participation of entire team - Improves quality of products/services - Compares what was planned vs. what was obtained - Allows correcting errors
- HOW TO USE IT
- 1. Plan: Detect a problem and think of a solution 2. Do: Apply the solution 3. Check/Verify: Check if it worked 4. Act: Correct what didn't work and keep what did
- WHAT IS IT?
POKA-YOKE
- WHAT IS IT? / OBJECTIVE
- Main objective: Prevent a person from making a mistake OR detect it immediatelyBefore it causes: defective product, accident, or process problemHelps offer products/services that meet customer needs
- HOW IS IT USED?
- Identify the process: Understand what activity is performedIdentify possible errors: Observe what could go wrongFind the cause of the error: Determine why it happensDesign a prevention/detection mechanism: Create a solution with signals, shapes, colors, sensorsTest the mechanism: Check that it works correctlyFollow up: Make sure it continues working properly
- CHARACTERISTICS
- Prevents errors before they happenDetects errors quicklySimple: easy to understand mechanismsCan be used in different processes: factories, offices, schools, servicesReduces defective products
- WHAT IS IT? / OBJECTIVE
PARETO DIAGRAM
- WHAT IS IT?
- Type of statistical graphData is represented with bars in descending order (highest to lowest)Cumulative percentages are shown using a frequency polygon
- WHAT IS IT FOR?
- Used to find the reason behind a problem and how important each possible cause isPareto Principle (Pareto Law) - 80/20 Rule:80% of consequences come from 20% of causes80% of results come from 20% of activities
- HOW TO MAKE ONE?
- Collect data: Collect statistical data of the problem to be analyzed 2. Order by frequency: Arrange values by absolute frequency in descending order (highest to lowest)
- WHAT IS IT?
Informationen
- Beschreibung
- Mindmap am QUALITY TOOLS, erstellt von Nayla Campirano am 13/10/2026.
- Erstellt von
- Nayla Campirano
- Aufrufe
- 4
- Bewertung
Mehr zu Continuous Improvement and Lean