
Mindmap
Indicators of Development
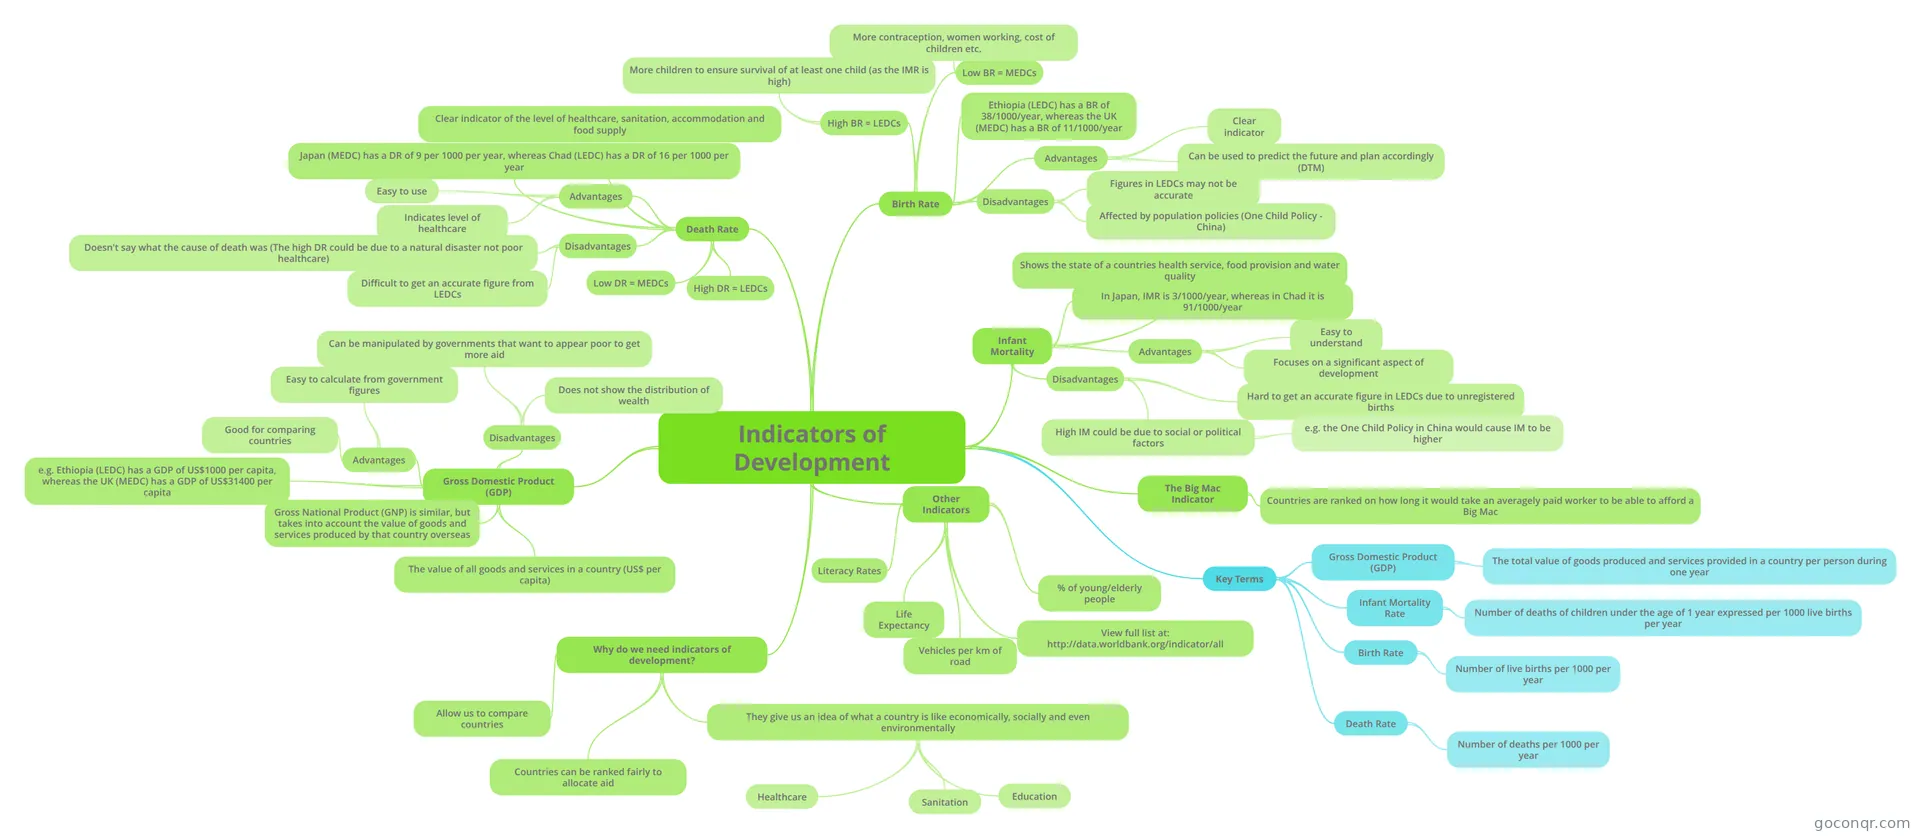
Mind map: Indicators of development
Inhalt der Mindmap
Indicators of Development
Why do we need indicators of development?
- Allow us to compare countries
- Countries can be ranked fairly to allocate aid
- They give us an idea of what a country is like economically, socially and even environmentally
- Healthcare
- Sanitation
- Education
The Big Mac Indicator
- Countries are ranked on how long it would take an averagely paid worker to be able to afford a Big Mac
Gross Domestic Product (GDP)
- The value of all goods and services in a country (US$ per capita)
- Gross National Product (GNP) is similar, but takes into account the value of goods and services produced by that country overseas
- Advantages
- Good for comparing countries
- Easy to calculate from government figures
- Disadvantages
- Does not show the distribution of wealth
- Can be manipulated by governments that want to appear poor to get more aid
- e.g. Ethiopia (LEDC) has a GDP of US$1000 per capita, whereas the UK (MEDC) has a GDP of US$31400 per capita
Infant Mortality
- Shows the state of a countries health service, food provision and water quality
- Advantages
- Easy to understand
- Focuses on a significant aspect of development
- Disadvantages
- Hard to get an accurate figure in LEDCs due to unregistered births
- High IM could be due to social or political factors
- e.g. the One Child Policy in China would cause IM to be higher
- In Japan, IMR is 3/1000/year, whereas in Chad it is 91/1000/year
Birth Rate
- High BR = LEDCs
- More children to ensure survival of at least one child (as the IMR is high)
- Low BR = MEDCs
- More contraception, women working, cost of children etc.
- Advantages
- Clear indicator
- Can be used to predict the future and plan accordingly (DTM)
- Disadvantages
- Affected by population policies (One Child Policy - China)
- Figures in LEDCs may not be accurate
- Ethiopia (LEDC) has a BR of 38/1000/year, whereas the UK (MEDC) has a BR of 11/1000/year
- High BR = LEDCs
Death Rate
- Clear indicator of the level of healthcare, sanitation, accommodation and food supply
- High DR = LEDCs
- Low DR = MEDCs
- Advantages
- Easy to use
- Indicates level of healthcare
- Disadvantages
- Doesn't say what the cause of death was (The high DR could be due to a natural disaster not poor healthcare)
- Difficult to get an accurate figure from LEDCs
- Japan (MEDC) has a DR of 9 per 1000 per year, whereas Chad (LEDC) has a DR of 16 per 1000 per year
Key Terms
- Infant Mortality Rate
- Number of deaths of children under the age of 1 year expressed per 1000 live births per year
- Birth Rate
- Number of live births per 1000 per year
- Death Rate
- Number of deaths per 1000 per year
- Gross Domestic Product (GDP)
- The total value of goods produced and services provided in a country per person during one year
- Infant Mortality Rate
Other Indicators
- Literacy Rates
- Life Expectancy
- % of young/elderly people
- Vehicles per km of road
- View full list at: http://data.worldbank.org/indicator/all
Informationen
- Beschreibung
- Using Population as Indicators of Development | AQA AS Geography A Population
- Erstellt von
- james_hobson
- Aufrufe
- 220
- Tags
- Bewertung