
Mindmap
STEPS TO ANALIZE QUANTITATIVE DATA
Inhalt der Mindmap
STEPS TO ANALIZE QUANTITATIVE DATA
1. PREPARING AND ORGANIZING THE DATA
- 1. SCORING THE DATA
- 1.1 The researcher assigns a numeric score (or value) to each response category for each question on the instruments used to collect data.
- 1.2 Creating a codebook
- List of variables or questions that indicates how the researcher will code or score responses from instruments or checklists.
- 1.2 Creating a codebook
- 1.1 The researcher assigns a numeric score (or value) to each response category for each question on the instruments used to collect data.
- 4. IMPUTTING THE DATA
- When the reseacher transfers the data from the responses on instruments to a computer file for analysis. (e.g., Excel).
- 3.SELECTING A COMPUTER PROGRAM
- 3.1 researchers select a computer program to analyze their data. Academic researchers generally use statistical programs available as software programs.
- 3.2 selecting a statistical program involves find a program with documentation about how to use the program(tutorials),make sure that the program can analyze the amount of data in your database. Consider participants and the maximum number of variables .
- 3.1 researchers select a computer program to analyze their data. Academic researchers generally use statistical programs available as software programs.
- 2. DETERMINING THE TYPES OF SCORES TO USE
- 2.1 A single-item score: is an individual score assigned to each question for each participant in your study.
- 2.2 Summed Scores: Summed scores are the scores of an individual added over several questions that measure the same variable.
- 2.3 Difference Scores: represent a difference or change for each individual
- 2.2 Summed Scores: Summed scores are the scores of an individual added over several questions that measure the same variable.
- 2.1 A single-item score: is an individual score assigned to each question for each participant in your study.
- 5. CLEANING THE DATA
- 5.1 Arranges the values of a variable from the smallest number to the largest, a visual inspection of data helps to clean the data and free it from visible errors before you begin the data analysis.
- 5.2 Assessing the Database for Missing Data
- are data missing in the database because participants do not supply it. In this case, you have a couple of options:
- You can eliminate participants with missing scores
- or can substitute numbers for missing data in the database for individuals.
- are data missing in the database because participants do not supply it. In this case, you have a couple of options:
- 5.2 Assessing the Database for Missing Data
- 5.1 Arranges the values of a variable from the smallest number to the largest, a visual inspection of data helps to clean the data and free it from visible errors before you begin the data analysis.
- 1. SCORING THE DATA
2. CONDUCT DESCRIPTIVE ANALYSIS
- 2.1 You use statistics, the calculations of values based on numbers. Many helpful books provide details about different statistics, their computation, and assumptions
- Choosing a Descriptive Statistics Test Descriptive statistics will help you summarize the overall trends or tendencies in your data,
- Measures of central tendency are summary numbers that represent a single value in a distribution of scores (Vogt, 2005). They are expressed as an average score (the mean), the middle of a set of scores (the median), or the most frequently occurring score (the mode).
- Measures of Variability indicates the spread of the scores in a distribution. Range, variance, and standard deviation all indicate the amount of variability in a distribution of scores. T
- The range of scores is the difference between the highest and the lowest scores
- The variance indicates the dispersion of scores around the mean.
- Measures of relative standing are statistics that describe one score relative to a group of scores:
- A percentile rank of a particular score is the percentage of participants in the distribution with scores at or below a particular score.
- A standard score is a calculated score that enables a researcher to compare scores from different scales. It involves the transformation of a raw score into a score with relative meaning
- Measures of relative standing are statistics that describe one score relative to a group of scores:
- The variance indicates the dispersion of scores around the mean.
- The range of scores is the difference between the highest and the lowest scores
- Measures of Variability indicates the spread of the scores in a distribution. Range, variance, and standard deviation all indicate the amount of variability in a distribution of scores. T
- Measures of central tendency are summary numbers that represent a single value in a distribution of scores (Vogt, 2005). They are expressed as an average score (the mean), the middle of a set of scores (the median), or the most frequently occurring score (the mode).
- Choosing a Descriptive Statistics Test Descriptive statistics will help you summarize the overall trends or tendencies in your data,
- 2.1 You use statistics, the calculations of values based on numbers. Many helpful books provide details about different statistics, their computation, and assumptions
3. CONDUCT INFERIAL ANALYSIS
- 3.1 Examine a sample or look at scores and use the results to draw inferences or make predictions about the population.
- 3.2 Several approaches exist for determining if the sample scores you receive are a good estimate of the population scores
- 3.2.1 Use hypothesis testing (comparing an observed value of a sample with a population value to determine if no difference or relationship exists between the values)to examine if the sample score probably a wrong estimate of the population means
- 3.2.2 A confidence interval or interval estimate is the range of upper and lower statistical values is likely to contain the actual population mean.
- 3.2.3 Effect size is a means for identifying if the sample score or differences between two groups make practical sense. Effect sizes tell us how different the sample values are and allow us to make a judgment
- 3.2.2 A confidence interval or interval estimate is the range of upper and lower statistical values is likely to contain the actual population mean.
- 3.2.1 Use hypothesis testing (comparing an observed value of a sample with a population value to determine if no difference or relationship exists between the values)to examine if the sample score probably a wrong estimate of the population means
- 3.2 Several approaches exist for determining if the sample scores you receive are a good estimate of the population scores
- 3.1 Examine a sample or look at scores and use the results to draw inferences or make predictions about the population.
4.REPORT RESULTS
- 6.1. The researcher presents detailed information about the specific results of the descriptive and inferential statistical analyses(in tables and figures) Report whether the hypothesis test was significant or not or information about the statistical test.
- A results section includes:
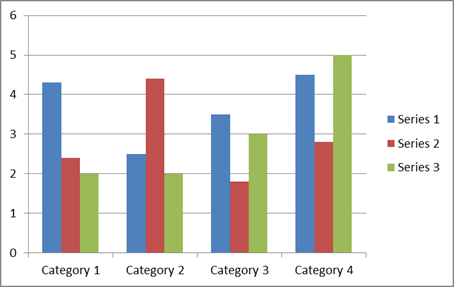
- • Tables that summarize statistical information: A table is a summary of quantitative data organized into rows and columns. You can present multiple statistical tests in one table
- • Figures (charts, pictures, drawings) that portray variables . A summary of quantitative data, whereas a figure presents information in graphs or in visual pictures (APA, 2010).
- • Detailed explanations about the statistical results
- Interpret results
- conclude a study by summarizing key findings, explanations for results, suggesting limitations in the research, and making recommendations for future inquiries.
- i. First summarize the major findings and present the broader implications
- ii. researchers explain why their results turned out the way they did.
- iii. Researchers also advance limitations or weaknesses of their study that may have affected the results.
- iv. Researchers next advance future research directions based on the results of the present study.
- iii. Researchers also advance limitations or weaknesses of their study that may have affected the results.
- ii. researchers explain why their results turned out the way they did.
- i. First summarize the major findings and present the broader implications
- conclude a study by summarizing key findings, explanations for results, suggesting limitations in the research, and making recommendations for future inquiries.
- Interpret results
- • Detailed explanations about the statistical results
- • Figures (charts, pictures, drawings) that portray variables . A summary of quantitative data, whereas a figure presents information in graphs or in visual pictures (APA, 2010).
- • Tables that summarize statistical information: A table is a summary of quantitative data organized into rows and columns. You can present multiple statistical tests in one table
- A results section includes:
- 6.1. The researcher presents detailed information about the specific results of the descriptive and inferential statistical analyses(in tables and figures) Report whether the hypothesis test was significant or not or information about the statistical test.
Bilder und Dateien der Mindmap

Informationen
- Beschreibung
- Mindmap am STEPS TO ANALIZE QUANTITATIVE DATA, erstellt von Pamela Cañar Jiménez am 02/06/2019.
- Erstellt von
- Pamela Cañar Jiménez · Jun 2019
- Aktualisiert
- 2 Jun 2019
- Aufrufe
- 0
- Bewertung