
Mindmap
Types of data
Inhalt der Mindmap
Types of data
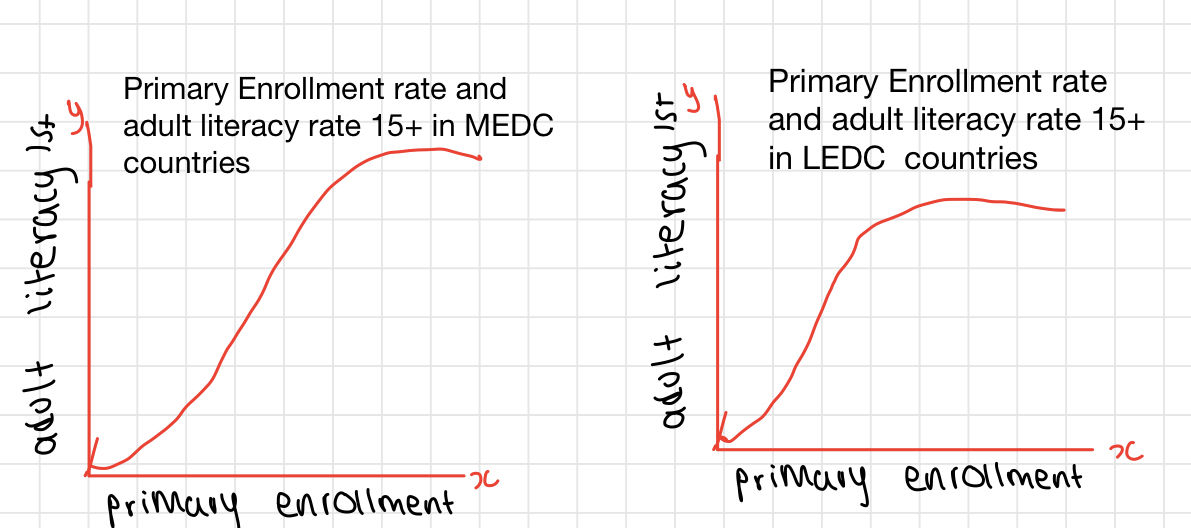
Cumulative Frequency graph
- The cumulative frequency is calculated from using the provided frequency in the distribution table which can be formed from the data in the table or stem and leaf.
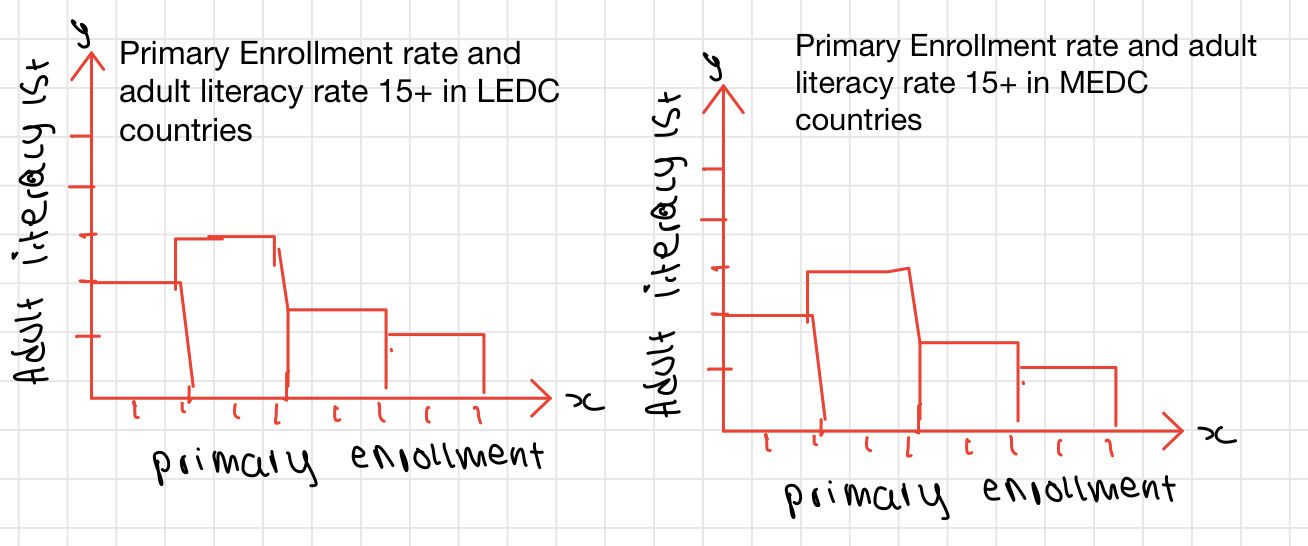
Histograms
- Histogram is used to plot the frequency of score occurrences in a continuous data set that has been divided into classes. This will fit perfectly as the audience can understand the relation between the students going to school and the adult literacy rate
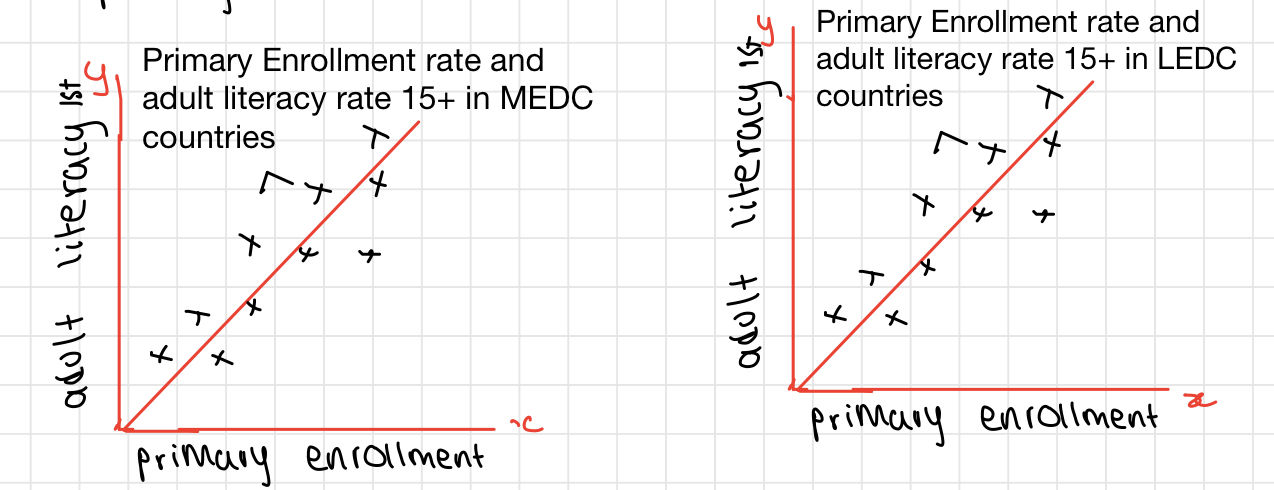
Scatter Graphs
- Scatter plot are used to understand and show relationships between two numeric variables. The crosses in the dots represent the values of individual data points. This graph can clearly show the relation and the line of best fit will show the trend.
Table or stem and leaf
- To organize the data
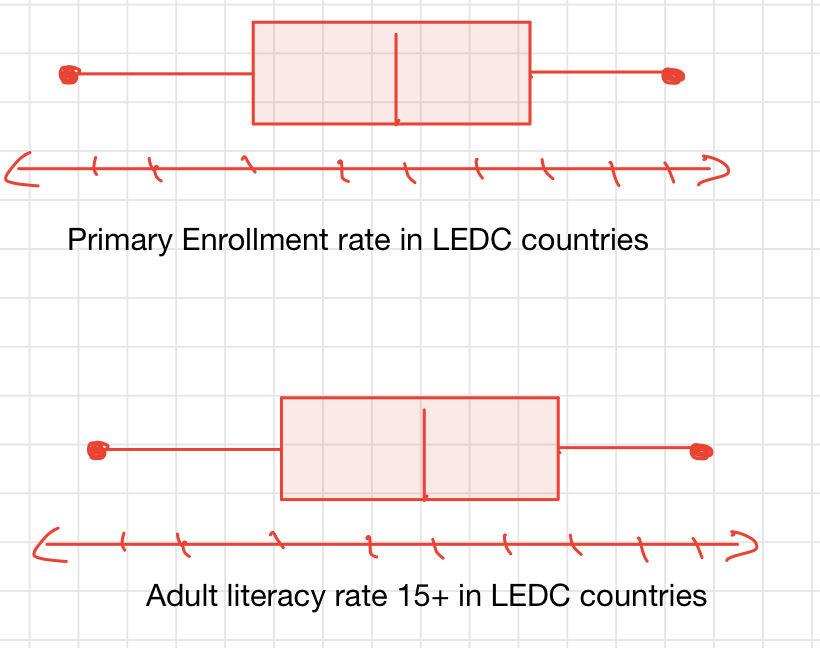
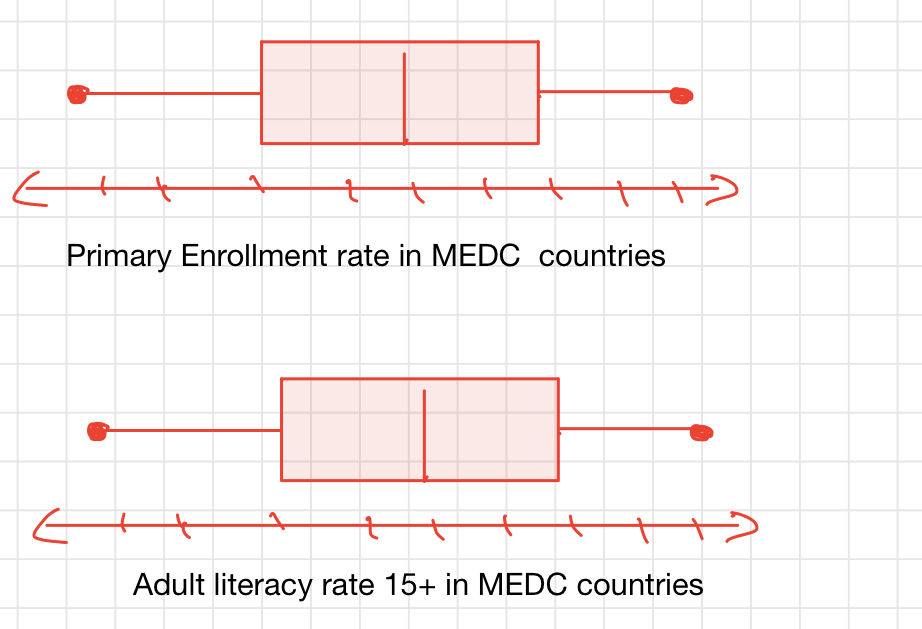
Box plot
- To show and summarize the data showing the range and median and how spread how the data is allowing comparison to be made and to show the clear trend and conclusion from the data.
Bilder und Dateien der Mindmap
Informationen
- Beschreibung
- Mindmap am Types of data, erstellt von Fayha Malik am 03/05/2020.
- Erstellt von
- Fayha Malik
- Aufrufe
- 0
- Bewertung