
Data Representation and Frequency Distributions
110 resources created by 99 users
This Data Representation and Frequency Distributions page on GoConqr gathers community-made mind maps, flashcards, quizzes, notes and slides, from choosing a chart to frequency tables, histograms and the data handling cycle. It's built for school students revising a topic, university students filling gaps, primary pupils meeting graphs for the first time, and teachers after ready-made material. There are over 80 resources here, including more than 20 mind maps and more than 30 flashcard decks. Pick a resource, try a quiz to spot your gaps, then make your own.
Top Data Representation and Frequency Distributions resources
-
3 cardsFREQUENCY TABLES: MODE, MEDIAN AND MEAN What is the MODE in a frequency table?
-
6 cardsMethods of displaying quantitative data
-
10 questionsLet's Try This! What type of graph is this?
-
25 cardsChapter 2 mostly describes graphs and their proper use
-
3 cardsData Handling
-
6 cardsDEALING WITH DATA DIFFERENT KEY WORDS LINKED TO DATA
-
9 cardsKey Words - Ch. 1 Vocabulary for Chapter 1.
-
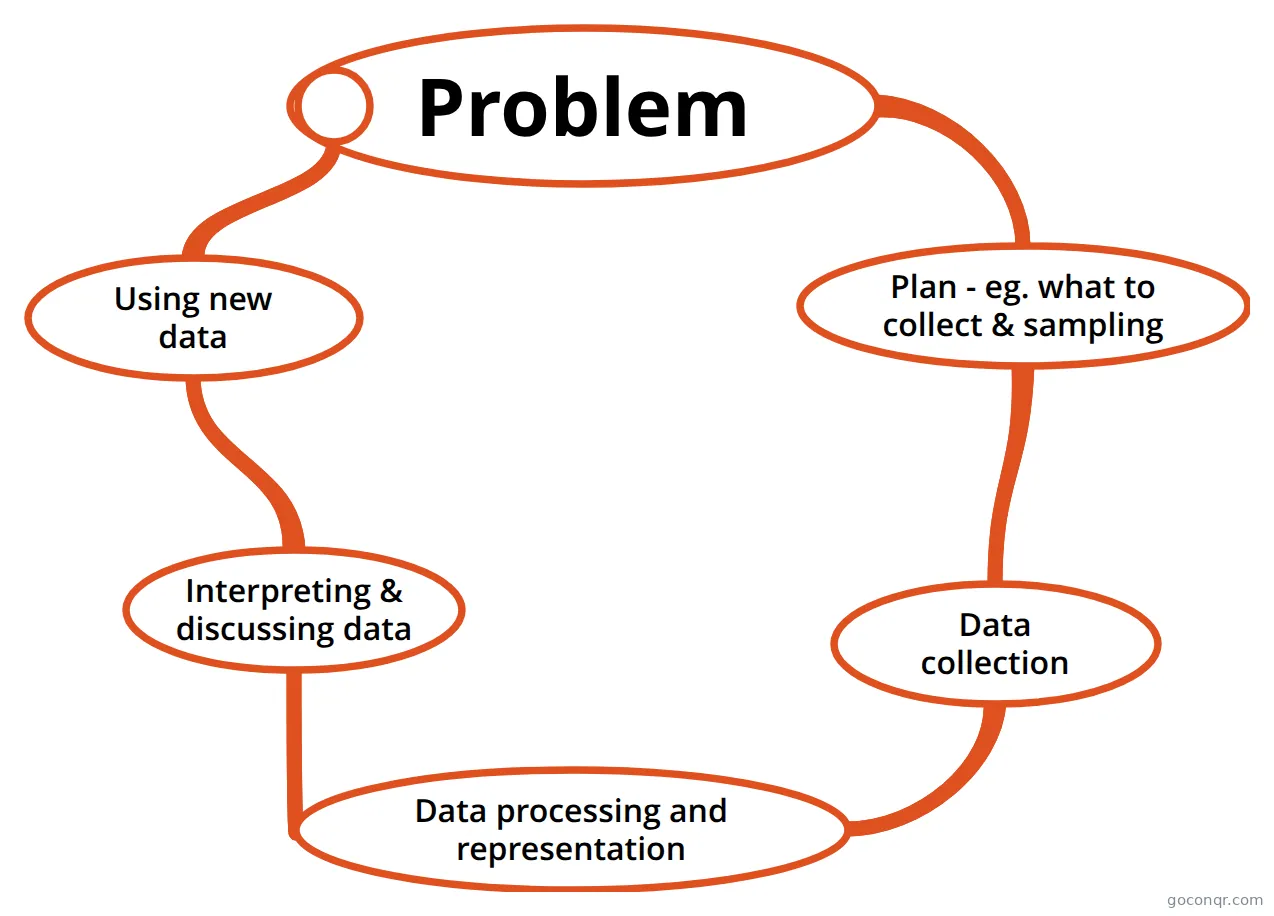 Mind map Problem Data cycle for Data Handling course
Quizzes
See all 13 quizzesMind maps
See all 32 mind mapsFlashcards
See all 52 flashcards-
3 cardsFREQUENCY TABLES: MODE, MEDIAN AND MEAN What is the MODE in a frequency table?
-
6 cardsMethods of displaying quantitative data
-
25 cardsChapter 2 mostly describes graphs and their proper use
-
3 cardsData Handling
-
6 cardsDEALING WITH DATA DIFFERENT KEY WORDS LINKED TO DATA
-
9 cardsKey Words - Ch. 1 Vocabulary for Chapter 1.
-
5 cardsMaths Unit 1
-
5 cardsData Handling Chapter 12, Data Handling
Notes
Slides
More Statistics and probability topics
About Data Representation and Frequency Distributions
GoConqr OriginalWhat this unit covers
This page sits in the Descriptive Statistics strand of Statistics and probability. It is about turning raw data into tables and pictures, then reading them. The resources cover bar charts, pie charts, line graphs, scatter plots, dot plots, stem and leaf plots, histograms and time plots. They also cover frequency tables, cumulative frequency and the idea of a distribution's shape, centre and spread.
Where to start
Begin with the mind map Which visual representation do I use? It splits data into univariate and bivariate, then into categorical and numerical, and links each type to a suitable chart. It gives you the big picture before the detail.
Next, open the Data Handling Cycle mind map. It walks through collecting and organising data, analysing and representing it, and then interpreting and discussing it.
Building the detail
- Work through the deck FREQUENCY TABLES: MODE, MEDIAN AND MEAN to practise finding each average from a table.
- Use Different ways to represent data to check why you would pick a pie chart, bar chart, line graph or scatter plot.
- Read the note Representing data - created from Mind Map to see how histograms differ from bar charts.
- Try STAB22 - Chapter 4 Flashcards for terms such as skew, tails, mode, resistant measures and the five number summary.
The map on cartographic data presentation adds dot maps and choropleth maps, with the pros and cons of each. It is a useful extra if you meet data on maps.
Using quizzes and maps together
Read a mind map first, then test yourself. The page has quizzes such as Selecting Graphs Quiz and 1_Data Handling process, plus a simpler one for younger pupils. If a question catches you out, go back to the matching map or deck, then retry the quiz.
Teachers can use the slide sets and notes as ready-made starting points for a lesson or a revision task. Every resource was made by GoConqr users, so styles and levels vary. Most are aimed at school level, with a good share for university students.
Next step
Choose one map today, skim it, then take a quiz on the same idea and see what you remember.
Frequently asked questions
Which resource should I open first?
Start with the mind map Which visual representation do I use? It sorts data into categorical and numerical, single-variable and two-variable, and shows which chart fits each. Once you have that overview, move on to the frequency table flashcards and the histogram notes for the detail.
What do the mind maps on this page cover?
They cover choosing charts, the data handling cycle, types of data such as discrete, continuous, nominal and ordinal, dot plots, time plots and cartographic maps. Some are short outlines and others are fuller, so open a few and see which suits the way you study.
Are the resources free to use?
Yes. Every resource listed here is free to open, study and take, with no account needed. They were made by GoConqr users, not by GoConqr itself. A free account also saves your quiz scores and lets you make your own quizzes, mind maps, flashcards and notes.
Which levels are these resources for?
Most are for school students, with a good share for university students and a smaller set for primary pupils, such as the Year 5 graph quiz. Teachers will find slide sets and notes they can adapt. Check a resource's title and first lines to judge whether it matches your level.
How do I practise averages from a frequency table?
Open the flashcard deck FREQUENCY TABLES: MODE, MEDIAN AND MEAN. It asks what each average means in a frequency table, so you can test yourself before trying questions. The Cumulative Frequency deck is a natural follow-up for medians and running totals.
What if I can't find the topic I need?
Try nearby titles first, since many decks are named Data Handling or Graphs and cover similar ground. If nothing fits, you can make your own mind map, flashcards or quiz with a free account and keep it for revision.