
Mindmap
Qualitative Data Analysis
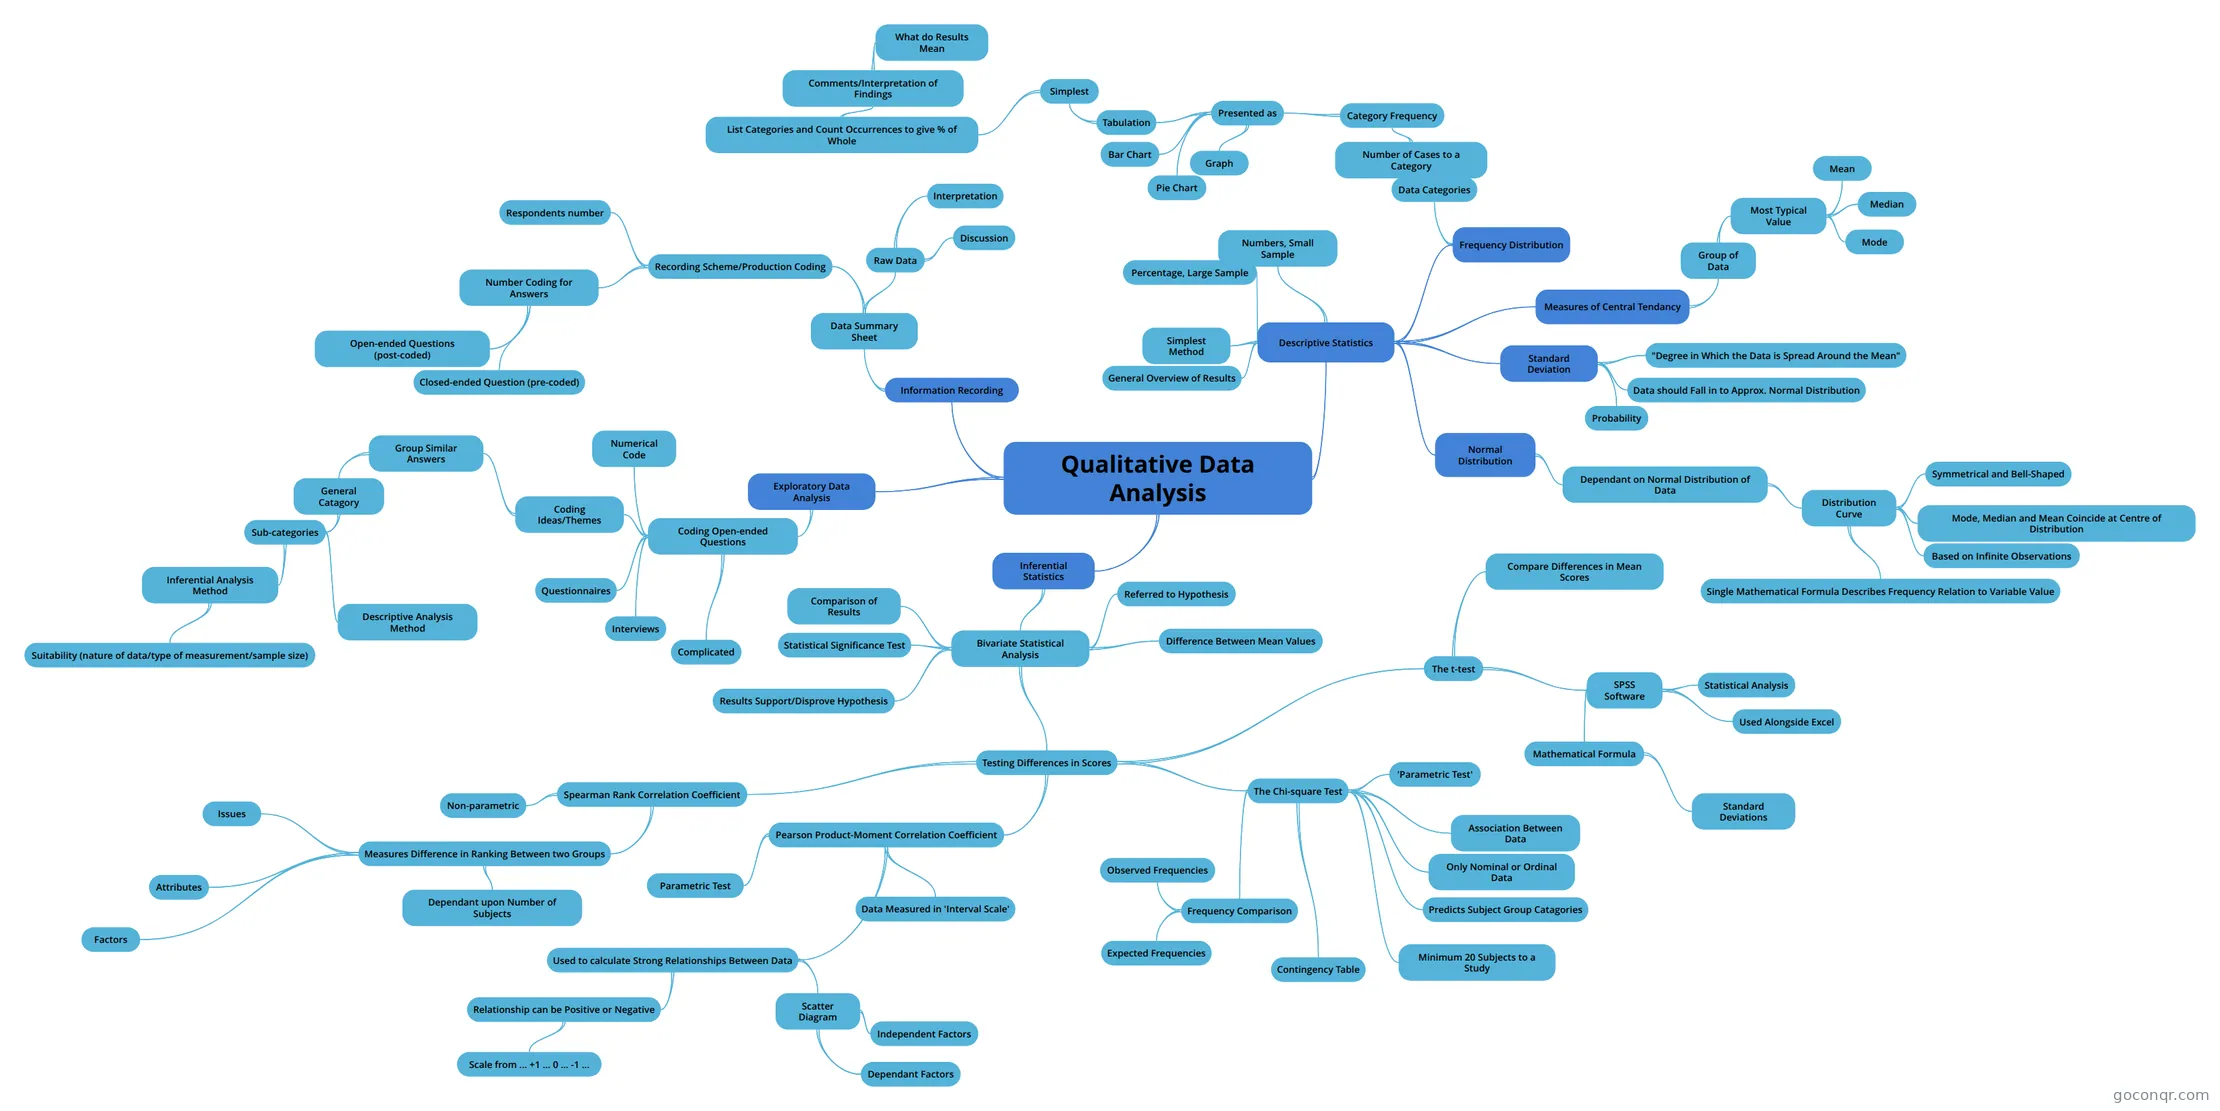
Mind map: Qualitative Data Analysis
Inhalt der Mindmap
Qualitative Data Analysis
Information Recording
- Data Summary Sheet
- Recording Scheme/Production Coding
- Respondents number
- Number Coding for Answers
- Open-ended Questions (post-coded)
- Closed-ended Question (pre-coded)
- Raw Data
- Interpretation
- Discussion
- Recording Scheme/Production Coding
- Data Summary Sheet
Descriptive Statistics
- Frequency Distribution
- Data Categories
- Number of Cases to a Category
- Category Frequency
- Presented as
- Tabulation
- Simplest
- List Categories and Count Occurrences to give % of Whole
- Comments/Interpretation of Findings
- What do Results Mean
- Comments/Interpretation of Findings
- List Categories and Count Occurrences to give % of Whole
- Simplest
- Bar Chart
- Pie Chart
- Graph
- Tabulation
- Presented as
- Category Frequency
- Number of Cases to a Category
- Data Categories
- Measures of Central Tendancy
- Group of Data
- Most Typical Value
- Mean
- Median
- Mode
- Most Typical Value
- Group of Data
- Standard Deviation
- "Degree in Which the Data is Spread Around the Mean"
- Data should Fall in to Approx. Normal Distribution
- Probability
- Normal Distribution
- Dependant on Normal Distribution of Data
- Distribution Curve
- Symmetrical and Bell-Shaped
- Mode, Median and Mean Coincide at Centre of Distribution
- Based on Infinite Observations
- Single Mathematical Formula Describes Frequency Relation to Variable Value
- Distribution Curve
- Dependant on Normal Distribution of Data
- Simplest Method
- General Overview of Results
- Percentage, Large Sample
- Numbers, Small Sample
- Frequency Distribution
Exploratory Data Analysis
- Coding Open-ended Questions
- Questionnaires
- Interviews
- Complicated
- Coding Ideas/Themes
- Group Similar Answers
- General Catagory
- Sub-categories
- Descriptive Analysis Method
- Inferential Analysis Method
- Suitability (nature of data/type of measurement/sample size)
- Sub-categories
- General Catagory
- Group Similar Answers
- Numerical Code
- Coding Open-ended Questions
Inferential Statistics
- Bivariate Statistical Analysis
- Comparison of Results
- Statistical Significance Test
- Testing Differences in Scores
- The t-test
- Compare Differences in Mean Scores
- SPSS Software
- Mathematical Formula
- Standard Deviations
- Statistical Analysis
- Used Alongside Excel
- Mathematical Formula
- The Chi-square Test
- Association Between Data
- Only Nominal or Ordinal Data
- Predicts Subject Group Catagories
- Minimum 20 Subjects to a Study
- 'Parametric Test'
- Contingency Table
- Frequency Comparison
- Observed Frequencies
- Expected Frequencies
- Spearman Rank Correlation Coefficient
- Non-parametric
- Measures Difference in Ranking Between two Groups
- Issues
- Attributes
- Factors
- Dependant upon Number of Subjects
- Pearson Product-Moment Correlation Coefficient
- Parametric Test
- Used to calculate Strong Relationships Between Data
- Relationship can be Positive or Negative
- Scale from ... +1 ... 0 ... -1 ...
- Scatter Diagram
- Independent Factors
- Dependant Factors
- Relationship can be Positive or Negative
- Data Measured in 'Interval Scale'
- The t-test
- Difference Between Mean Values
- Results Support/Disprove Hypothesis
- Referred to Hypothesis
- Bivariate Statistical Analysis
Informationen
- Beschreibung
- Mindmap am Qualitative Data Analysis, erstellt von jamieday2006 am 04/10/2015.
- Erstellt von
- jamieday2006
- Aufrufe
- 10
- Bewertung