
Mindmap
Bivariate statistical measures regression and correlation
Inhalt der Mindmap
Bivariate statistical measures regression and correlation
Bivariate statistical techniques allow the joint analysis of two characteristics of individuals in a population with the purpose of detecting possible relationships between them.
- Covers the following topics
- regression
- It is a statistical technique that allows us to change one of the variables called response and that corresponds to another known as the explanatory variable.
- it's divided in
- linear regression
- Regression examines the relationship between two variables by restricting one of them with respect to the other in order to study the variations of the first when the other remains constant. Regression is a method used to forecast or predict the value of a variable based on of the given values of the other or of the others when working with more than two variables
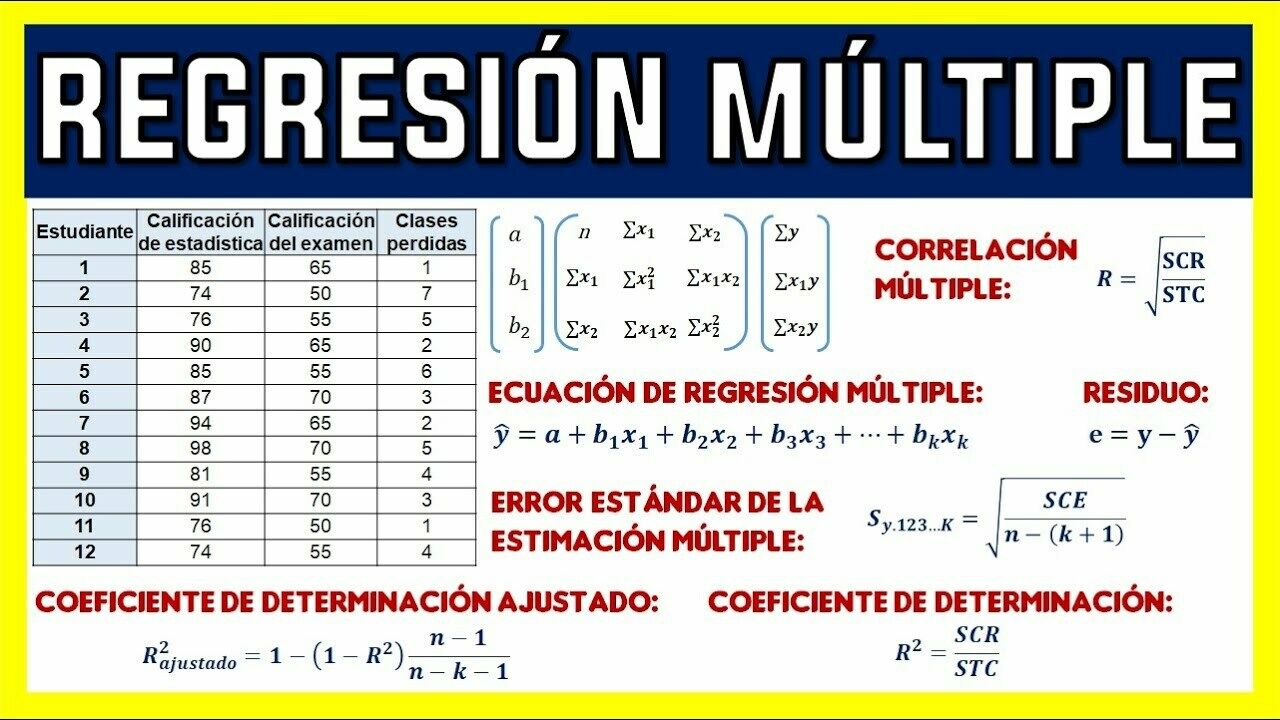
- multiple regression
- allows working with a variable at the interval or ratio level, in the same way it is possible to analyze the relationship between two or more variables through
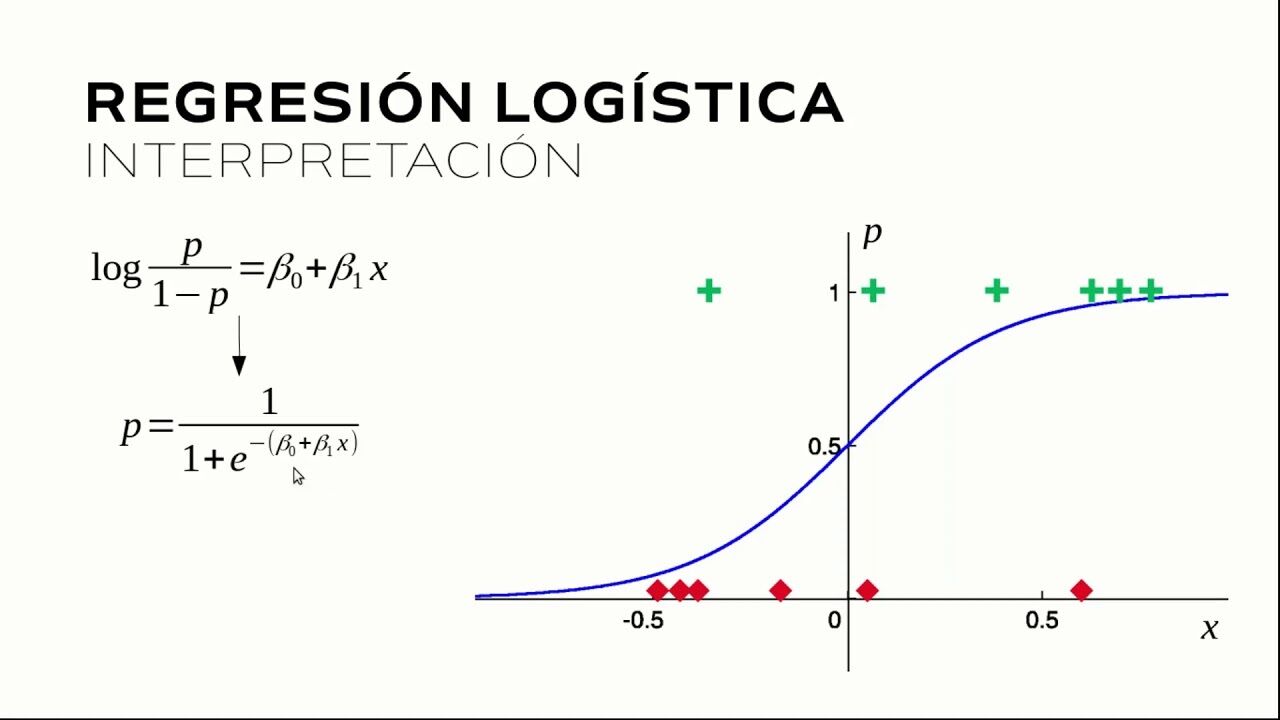
- Logistic regression
- Used to predict the outcome of a categorical variable a variable that can take on a limited number of categories based on the independent or predictor variables
- linear regression
- it's divided in
- It is a statistical technique that allows us to change one of the variables called response and that corresponds to another known as the explanatory variable.
- Correlation
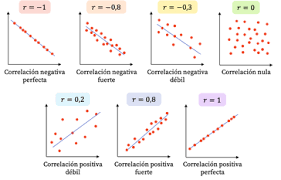
- The correlation between two variables Seeks to determine the degree of relationship that exists between the two of them is calculated with the correlation coefficients The correlation coefficients are numbers that vary between plus 1 and minus one their magnitude indicates the degree of association between the variables if it is 0 indicates that there is no relationship between any and the outer values plus 1 and minus one indicate a perfect positive or negative correlation
- it's divided in
- positive correlation
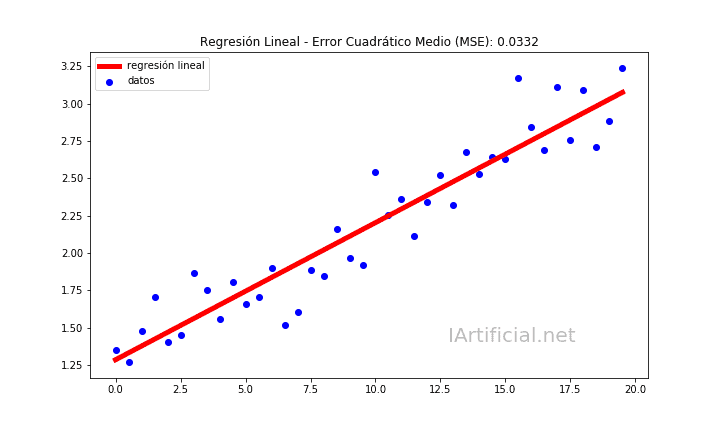
- It is said that there is a positive linear correlation between two variables if, as the values of the independent variable increase or decrease, it does not decrease in those of the dependent variable. In a scatter plot, the cloud of points has an ascending shape and therefore the line that fits will have a positive slope
- negative correlation
- When the values of the independent variable increase, the values of the dependent variable decrease or vice versa, it is said that the linear correlation is negative. In this case, the cloud of points will descend from left to right and the slope of the line adjusts or will be negative.
- positive correlation
- regression
- Covers the following topics
bivariate statistics
- Bivariate statistical techniques allow the joint analysis of two characteristics of individuals in a population with the purpose of detecting possible relationships between them.
- Dispersion diagram
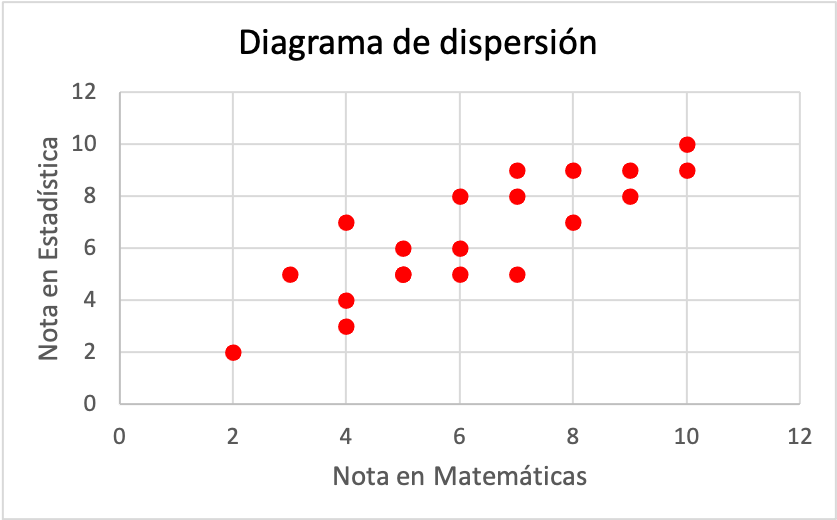
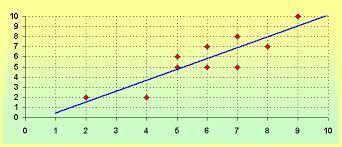
- A two-dimensional or bivariate distribution can be represented graphically on a Cartesian plane by locating the values of the first variable called x on the horizontal or abscissa axis and the values of the second variable ye on the vertical or ordered axis, so that as many ordered pairs as There are observations of the variables to that set of points or cloud of points is called a scatterplot Since the points are located in a dispersed way in the Cartesian plane
- Dispersion diagram
- Bivariate statistical techniques allow the joint analysis of two characteristics of individuals in a population with the purpose of detecting possible relationships between them.
Bilder und Dateien der Mindmap
Informationen
- Beschreibung
- Mindmap am Bivariate statistical measures regression and correlation, erstellt von jessica escarria am 01/09/2022.
- Erstellt von
- jessica escarria
- Aufrufe
- 1
- Bewertung