6327168
Beschreibung
Mindmap von Freda Fung, aktualisiert more than 1 year ago
|
|
Erstellt von Freda Fung
vor mehr als 9 Jahre
|
|
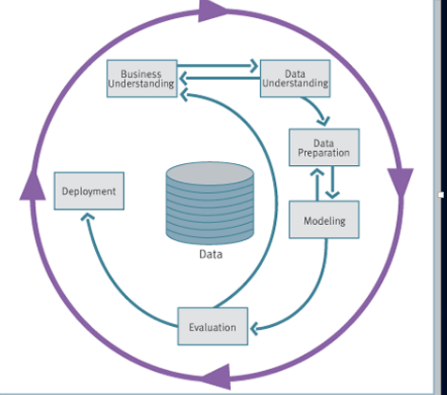
Data Pre-processing
- Knowledge Discovery Flow
Anmerkungen:
- Data preperation/pre-processing estimated take 70-80% of the time and effort
- Data Quality Measure
- Accuracy
- Completeness
- Consistency
- Timeliness
- Believability
- Value added
- Value Added
- Interpretability
- Accessibility
- Accuracy
- No qality data
- Incomplete
Anmerkungen:
- missing attribute values, missing certain attributes of interest, containing only aggregate data
- Noisy
Anmerkungen:
- Filled with errors or outliers
- Inconsistent
Anmerkungen:
- Containing discrepancies in codes, names or values
- Incomplete
- Main Task
- Data Cleaning
- Fill in missing values
- Missing Data
Anmerkungen:
- May due to: Equipment malfunctionInconsistent with other recorded data and thus deletedData not entered due to misunderstandingCertain data may not be considered important at the time of entryNot registered in history or changes of the dat
- Ignore
Anmerkungen:
- Especially when the class label is missing – e.g. remove fr dataset. Bad! If there are many instances with missing values(it may mean sth) If dataset is big, ok, remove it, if it is small, you have to live with it.
- Fill in value manully
- Fill in with attribute mean
Anmerkungen:
- Use the attribute mean to fill in every missing value for that attribute –become noise
- Bayesian formula or decision tree
Anmerkungen:
- Use Bayesian formula or decision tree to know what is the most probable value to fill in the missing value = downside: problem of biasing.
- Use different models
Anmerkungen:
- Solution: use different model. e.g. Naiive bay is what the model is using, then use other e.g. J48 for prediction
- Fill in with attribute mean
- Expectation Maximization
Anmerkungen:
- Build model of the data (ignoring missing values) Use the model to estimate missing values Build new models of data values (including the estimated values) Use new models to re-estimate missing values Repeats until convergence (old model = new model)
- Missing Data
- Smooth noisy data
Anmerkungen:
- data still w/n normal range, but actually wrong value.
- Incorrect attribute values may be due toFaulty data collection instrumentsData entry problemsData transmission problemsTechnology limitationInconsistency in naming conventions
- Binning Method
Anmerkungen:
- Sort data and partition into (equal-depth) bins Sort data, partition them, and to arrange them into different bins, calculate frequency of each bin.
- Smooth by bin means, smooth by bin median, smooth by bin boundaries, etc. Change all value to 1 value (e.g. mean/ median/ boundaries) Boundaries = find the mean of the group of data, data below the mean change to the minimum no, above change to the max no within the group.
- Equal-width (distance) partitioning
Anmerkungen:
- divide the range into N intervals of equal size: for N bins, the width of each interval will be W = (maxValue - minValue)/N
- Straightforward but outliers may dominate presentation - worst for skewed data.
- Equal - depth (frequency) partitioning
Anmerkungen:
- Divide the range into N intervals so that each interval contains approximate the same number of samples (the interval doesn't need to have the same width) - good data scaling
- Clustering
Anmerkungen:
- Detect & remove outliers
- Remove data that does not belong to any group
- Combined Computer & Human Inspection
Anmerkungen:
- Detect suspicious values & check by human - Handle inconsistent data
- Semi-automatic Detect violation of known functional dependencies and data constraints E.g. use dictionary or grammar rules Correct redundant data Use correlational analysis or similarity measures to detect redundant data
- Soothing
- Partition into (equi-dept) bins
- Smoothing by bin means
Anmerkungen:
- change all values in a bin to the mean of the bin
- Smoothing by bin boundries
Anmerkungen:
- val <mean (bin) --> minVal(bin) val > mean(bin) --> manVal(bin)
- Regression
Anmerkungen:
- Smooth al the values according to the best line fit smooth by fitting the data into regression functions
- Partition into (equi-dept) bins
- Identify or remove outliers
Anmerkungen:
- outliers = sth outside the range - define the normal range first e.g. mean & SD
- Resolve inconsistencies
- Remove duplicate re ords
- Fill in missing values
- Data integration
Anmerkungen:
- Combines data from multiple sources into a coherent store Integrate metadata from different sources
- Possible problems The same attribute may have different names in different data sources, e.g. CustID and CustomerNo One attribute may be a “derived” attribute in another table, e.g. annual revenue Different representation and scales, e.g. metric vs. British units, different currency, different timezone
- Data Reduction
Anmerkungen:
- Complex data analysis may take a very long time to run on the complete data set Obtain a reduced representation of the data set that is much smaller in volume but produces (almost) the same analytical results
- Strategy
- Dimensionality reduction
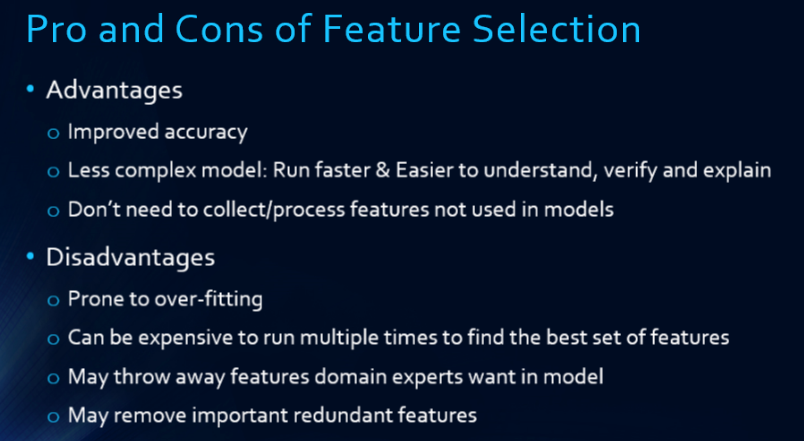
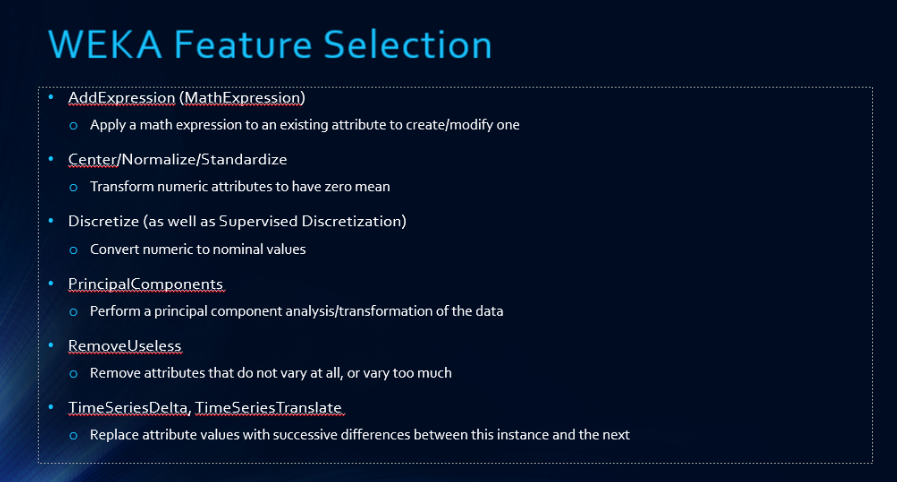
- Feature Selection
Anmerkungen:
- Select a minimum set of features so that the probability distribution of different classes given the values for those features is as close as possible to the original distribution given the values of all feature
- Reduce the number of attributes in the discovered patterns Makes the patterns easier to understand
- Ways to select attributes include Decision Tree induction (information gain and gain ratio) Principal Component Analysis (in 2 weeks time)
- Generally, keep top 50 attributes ** assignment: top 10.
- Ways
- Decision Tree
- Principal Component Analysis
- Decision Tree
- Approach
- Wrapper approach
Anmerkungen:
- (find the best attributes for the chosen classifier) Try all possible combinations of feature subsets Train on train set, evaluate on a validation set (or use cross-validation) Use set of features that performs best on the validation set Algorithm dependent
- Proxy method
Anmerkungen:
- Determine what features are important or not without knowing/using what learning algorithm will be employed Information gain, Gain ratio, Cosine similarity, etc.Algorithm independent & Fast but may not suitable for all algorithms
- Wrapper approach
- Sampling
Anmerkungen:
- Choose a representative subset of the data Simple random sampling may have very poor performance in the presence of skew
- Develop adaptive (stratified) sampling methods Approximate the percentage of each class Sample the data so that the class distribution stays the same after sampling
- Feature Selection
- Data Compression
- Discretization
Anmerkungen:
- Divide the range of a continuous attributes into intervals Interval labels can then be used to replace actual data values
- Normal Converting Numeric to Ordinal Converting Ordinal to Numeric
- Binning Methods
- Use info gain/gain
ratio to find the
best splitting
points
- Clustering analysis
- Concept hierarchy generalization
Anmerkungen:
- Replace low level concepts by higher level concepts E.g. Age: 15, 65, 3 to Age: teen, senior, child, middle-aged, etc Instead of street, use city or state or country for the geographical locatio
- Dimensionality reduction
- Quantity
Anmerkungen:
- Generally 5000 or more number of instances are desired If less, results are less reliable. Might need to use special methods like boosting There are at least 10 or more instances for each unique attribute value 100 more instances for each class label
- stratified sampling
Anmerkungen:
- If unbalanced, use stratified sampling Stratified sampling = u have the same number of instances per class label, not look at distribution
- Random Sampling
Anmerkungen:
- sample as they come
- Data Transformation
Anmerkungen:
- Sometimes it is better to convert nominal to numeric attributes So you can use mathematical comparisons on the fields E.g. instead of cold, warm, hot -> -5, 25, 33 Or A -> 85, A- -> 80, B+ -> 75, B ->70
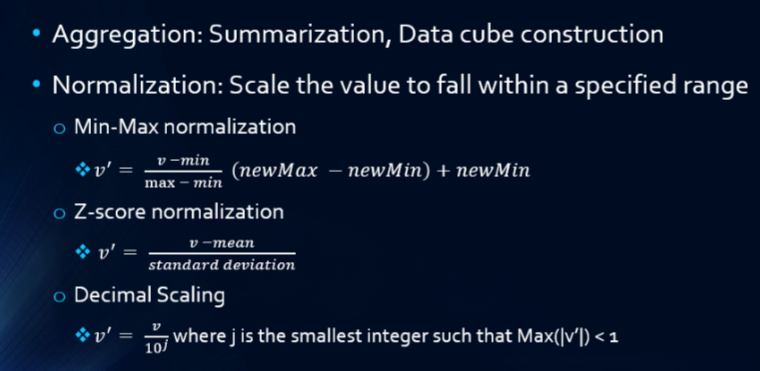
- Normalization
- Aggregation
- Data Cleaning
Medienanhänge
Möchten Sie kostenlos Ihre eigenen Mindmaps mit GoConqr erstellen? Mehr erfahren.