
Mindmap
Week 3
Inhalt der Mindmap
Week 3
Association Vs Causality
- An association is a connection between at least two variables, demonstrated by one tending to vary according to variations in the other.
- If a correlation exists between two variables this does not mean that one is the cause of the other.
- causality is a special case of association, when changes in one systematically result in direct changes in the other.
- Causality is hard to ascertain and we should be careful not to assume that one variable is 'causing' the other merely based on our statistically significant results.
Correlation: to establish a relationship among variables without researcher manipulation.
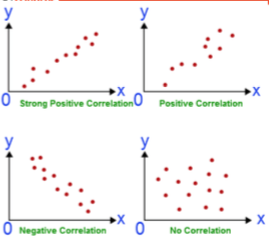
- Are two variables correlated? - does one increase as the other decreases? - do they both increases together.
- Correlation coefficient: a number between -1 and 1 that describes the relationship.
- how can we get a graphical representation of the degree of the relationship.
- Scatterplot: a graph containing a cluster of dots that represents all pairs of observations.
- Are two variables correlated? - does one increase as the other decreases? - do they both increases together.
Correlation coefficients.
- Pearson's correlation coefficient PARAMETRIC.
- When we compare two continuous variables that are normally distributed we may calculate pearson's r correlation coefficient which measures the strength of a linear relationship between the compared variables.
- A summary association measure for interval / ratio data – Ranges from -1 (perfect negative) to 0 (no relationship) to +1 (perfect positive) – Affected by outliers – Does not pick up curve-linear relationships
- When we compare two continuous variables that are normally distributed we may calculate pearson's r correlation coefficient which measures the strength of a linear relationship between the compared variables.
- Spearman's rho correlation coefficient NON-PARAMETRIC.
- When we compare two continuous variables that are NOT normally distributed.
- A summary association measure for ordinal data – Ranges from -1 to +1 – Affected by outliers – Does not pick up curve-linear relationships
- When we compare two continuous variables that are NOT normally distributed.
- The closer the correlation coefficient is to +1 or -1, the stronger the correlation; say, r=0.85 indicates that we have a strong positive relationship in our sample. But a strong correlation coefficient does not necessarily indicate a statistically significant correlation in that it may not provide enough evidence that the population correlation coefficient is different from zero. Similarly, a weak sample correlation coefficient, r=0.12, may be highly significant and may give us evidence that the correlation in the population differs from zero (meaning that the two investigated variables are indeed correlated).
- Pearson's correlation coefficient PARAMETRIC.
Interpreting risk ratio's
- examples of measures of associations are the risk ratio and the odds ratio
- Relative risks are calculated to assess risk in typically longitudinal or follow-up studies.
- if the RR is equal to 1, the numerator equals the denominator, and the risk in exposed persons equals the risk in non-exposed persons. that would mean that no evidence exists for any increased risk in the exposed or for any association of the disease with the exposure in question
- RR 1 - no evidence of effect. RR +1 evidence of effect/risk. RR-1 decreased effect/protective effect.
- If the RR is greater than 1, (RR > 1) the numerator is greater than the denominator, and the risk in exposed persons is greater than that in non- exposed persons. This is evidence of a positive association of the disease with the exposure in question.
- IftheRRislessthan1,(RR<1)thenumeratorislessthanthe denominator, and the risk in exposed persons is less than that in non- exposed persons. This is evidence of a negative association of the disease with the exposure in question, and it may indicate a protective effect.
Odds ratio
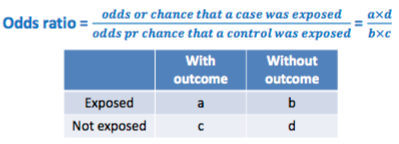
- The interpretation of the OR is similar to the interpretation of the RR. If the exposure is not related to the outcome, the OR will be 1. If the exposure is positively associated with the outcome, the OR will be greater than 1. If the exposure is negatively associated with the outcome, the OR will be less than 1.
research Hypothesis:
- Based on the theoretical ground, previous research results ad clinical experience of the researcher.
- Hypothesis testing • Is a procedure that allows us to evaluate hypotheses that are typically drawn from a theory and based on sample statistics. • A formal way of testing if we should accept results as being significantly different or not.
- A null hypotheis is a statement of "no difference". the null hypothesis suggests that there is no difference between the two variables.
- if the null hypothesis is found to be false than we have support for the research hypothesis and the broader theory.
- Examples of Hypothesis.
- Statistical analysis were used to test the hypothesis that the mean Box and Blocks scores at the three time points we equal.
- the hypothesis being tested us that the population means for the five GMFCS levels are the same across all the states and territories on the CP register.
- Testing Hypothesis
- One-tailed hypothesis test – A hypothesis to be tested where the sample statistic is believed to be either higher or lower when compared to another group.
- Two-tailed hypothesis test – A hypothesis test in which a sample statistic might fall within either tail of the sampling distribution. We are not sure which tail of the curve the statistic is likely to fall.
P Value
- the p-value is the smallest significance level A that leads us to rejecting the null hypothesis
- if the p value is 0.03 (or 3%) the correct interpretation. By convention, p values smaller than 0.05 are declared as statistically significant, that is, the found association is most probably not due to chance but is a real association.
Bilder und Dateien der Mindmap

Informationen
- Beschreibung
- OTHY305 Stats Mindmap am Week 3, erstellt von Tegan Rance am 19/10/2016.
- Erstellt von
- Tegan Rance
- Aufrufe
- 0
- Bewertung