
Notizen
Variables and associations
Inhalt der Notizen (6)
Seite 1
Variable and association types
Variable types
Continuous
Categorical
Association types
Involves minimally two variables
Continuous - Continuous: Pearson's correlation coefficient
Categorical - Categorical: Contingency tables
Pearson's product movement correlation coefficient
Scatterplots
Help bring the two variables in a single display
Placement of dots help determine if a pattern exists. (Linear, curved, incline of line)
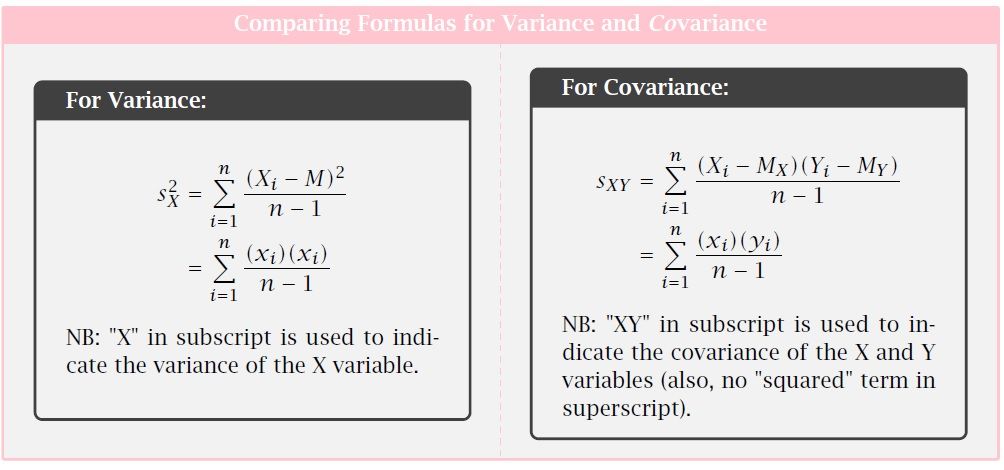
Covariance
Measures the degree of concurrent variation between two variables.
Measures strength and direction of two linearly associated variables.
In summary: The sum of the multiplication of the deviation scores of both variables/n-1
Since the two variables have different scaling, we need to transform them into Z scores.
This standardised covariability is known as the correlation.
Note: It is a sample statistic.
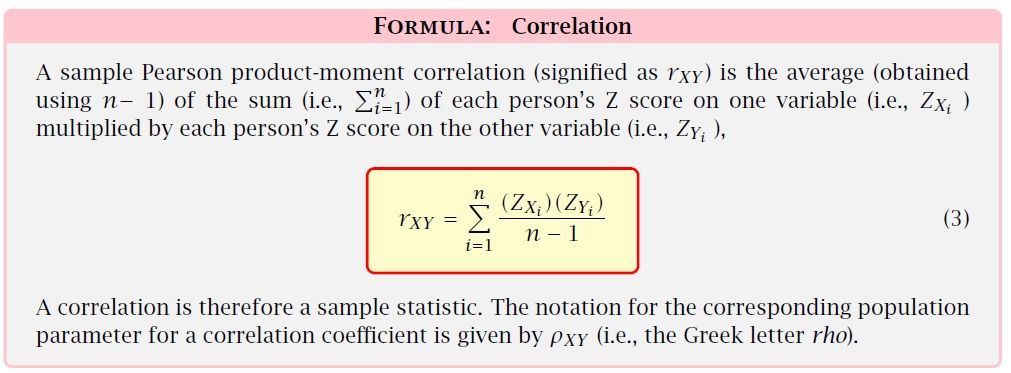
What does the r value mean?
Magnitude of the number indicates the strength.
+/- indicates whether the association is positive or negative.
Positivity - X increases, Y increases
Negativity - X increases, Y decreases
0 indicates no linear association (for purposes of this course negate linear).
Note: Linear associations depict symmetrical relationships (increase in equal proportions), hence ordering doesn't matter.
Degrees of freedom
The number of available choices before the outcomes can be determined.
Seite 2
Null hypothesis and correlation
Applying NHST to correlation
We want to find evidence whether there is an associate or not between the two variables.
Ho : \(\rho\) = 0
Ha: \(\rho\) \(\neq\) 0
Degree of freedom: n - 2
Note: +/- signs are not factored in hence we do not conclude that p>0 or p<0.
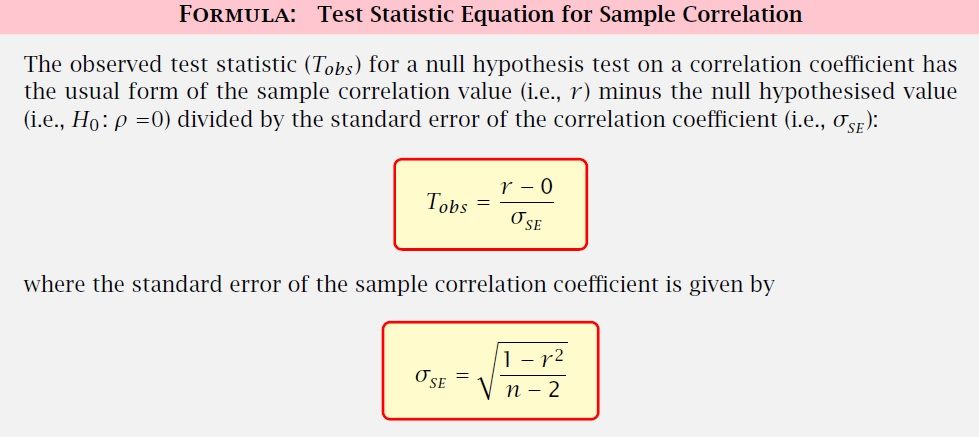
Like a normal NHST,
|Tobs|> Tcrit or p< alpha, null hypothesis is rejected.
Note: NHST can only be when Ho: p = 0. This is due to it being t distributed (normally distributed). Should other values of Ho be used, it would result in a different theoretical probability distribution.
Seite 3
Confidence intervals and correlation
Fishers r to Z transformation can be used to calculate confidence intervals for r.
Confidence intervals for r
What do they indicate?
Is the value Ho: \(\rho\) = 0 in the interval?
If yes, Ho becomes a plausible population parameter value and hence there is insufficient evidence to reject Ho.
That means that there is no association between the two variables.
If no, Ho is not a plausible population parameter value and there is sufficient evidence to reject Ho.
That means that there is some degree of association between the two variables.
Strength of the correlation for the upper and lower bound
At best, it is (upper bound) strong.
At worst, it is (lower bound weak.
+/- relationship between the two variables
Precision of the interval
What range of values does the CI cover?
e.g. (0.60, 0.06) has a precision of 54% as it covers 54% of the values from 0 to 1.
Note: +/- signs here do not matter as we are talking about the range of values from 0 to 1 not -1 to +1. Magnitude of r is from 0 to 1/ 0 to -1.
Note: Assumptions are made when using correlation values to make inferences, e.g. linear association, measured without error etc.
Seite 4
Categorical variables and contingency tables
Categorical variables
Can be represented in frequency tables.
Display single variable in one category.
Cross-classified contingency table
Displays two variables (or more) with joint membership in one category.
We can determine if there is dependency or independence between the categorical variables via a \(\chi^2\) null hypothesis test.
To do that we need observed and expected cell frequencies.
To calculate expected cell frequencies, we need marginal row and column frequencies.
Marginal row frequencies denoted by \(f_{x+}\)
Marginal column frequencies denoted by \(f_{+y}\)
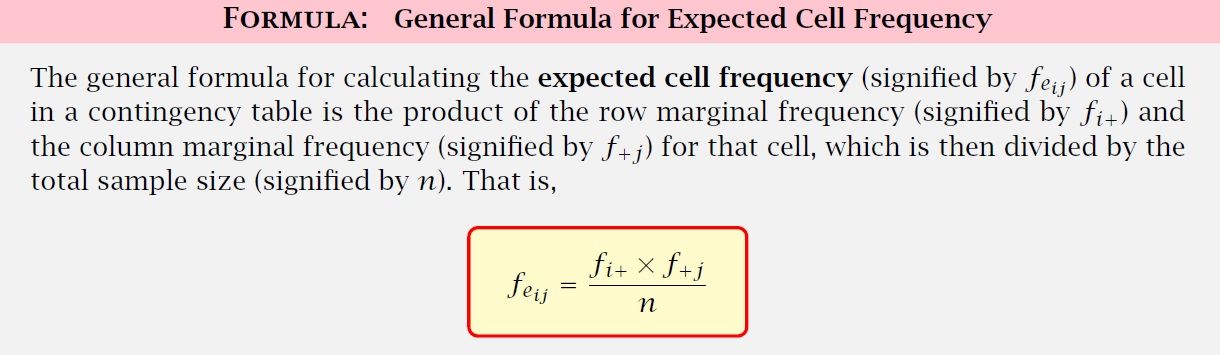
Properties of expected frequencies:
n
Marginal row frequencies
Marginal column frequencies
for both observed and expected cells will be the same.
Greater discrepancy between observed and expected cell frequencies indicate greater degree of dependency.
That means there is a stronger association between the variables and thus a larger \(\chi^2\) value.
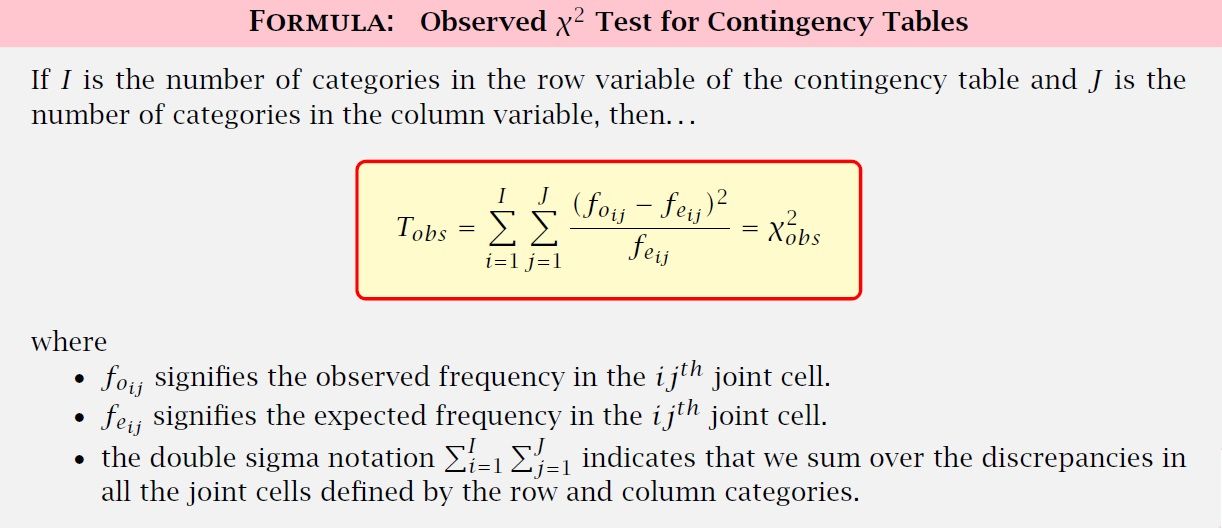
What does Tobs here signify?
Constructing a sampling distribution for Tobs would result it corresponding to a theoretical \(\chi^2\) probability distribution.
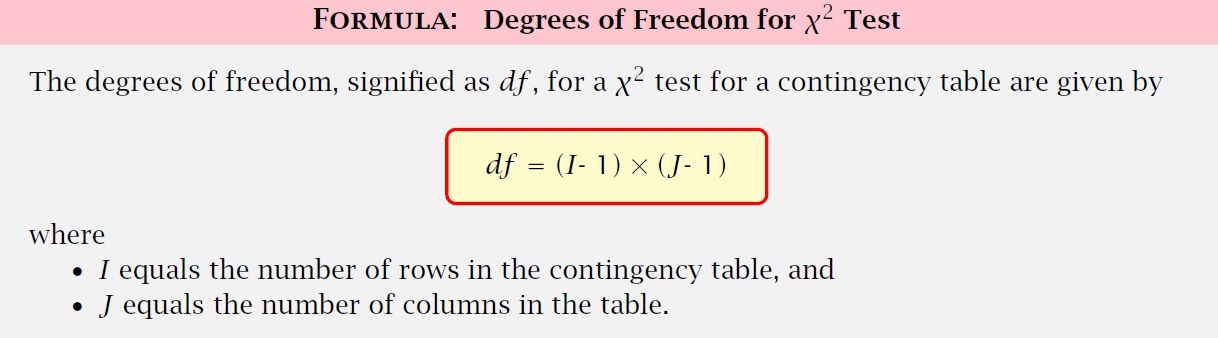
\(\chi^2\) probability distribution is a family of distributions defined by their df.
Since \(\chi^2\) values are squared, it cannot be (-) hence the critical rejection region for Ho lies in the upper tail.
> \(\chi^2\) values correspond to < p values.
Seite 5
Odds ratio
Odds
The probability of an event occurring relative to the probability of all other events occurring.
Odds ratio
The relative probability of one category of variable occurring relative to another different category of variable.
Value obtained from forming the ratio from two sets of odds.
One set of odds is P/(1-P).
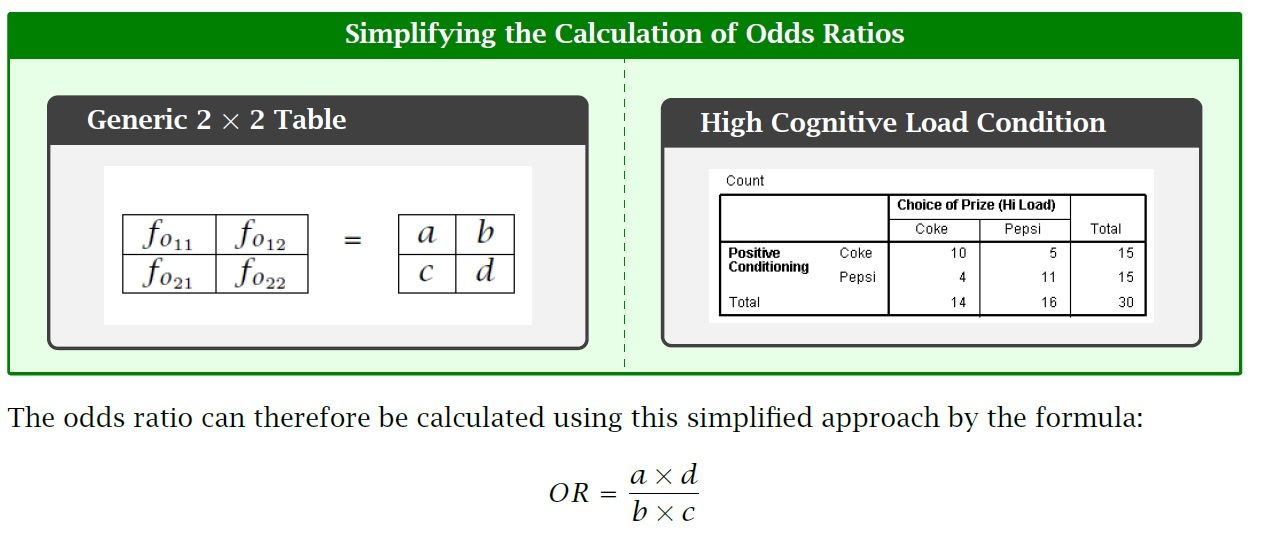
This formula is also an estimator as it is derived from sample statistics.
Properties of odds ratio:
Odds ratio can never be negative >0
If OR = 1, it indicates no association and independency between the two variables
Strength of an association depends on it's deviation from 1; 0.01 and 100 both indicate strong associations
OR is undefined if any cell frequency is 0
OR telly to the same value no matter what is defined at row/column
Confidence intervals and odds ratio
As long as the interval does not capture 1, the variables can be said to be associated.
If the interval contains 1, there is evidence that the variables are not associated.
Interpreting odds <1
Depending on how OR is calculated and where the values of the cell frequencies are places, a decimal ratio can be obtained.
By inverting/taking the reciprocals, and interpreting it as a lowered odds, the numbers would make more sense.
Note: When inverting ORs, the upper/lower bounds of OR intervals also becomes inverted.
Seite 6
Odds ratios/CIs vs \(\chi^2 \) values
Contingency tables and their estimators:
What do ORs provide that \(\chi^2 \) values do not?
ORs provide a direct measure of strength of the association between 2 categorical variables.
\(\chi^2 \) values only tell us whether there is or isn't a an association between 2 variables; strength of association cannot be determined as its value is affected by sample size.
CIs of ORs goes further:
Determines whether the null hypothesis of no association would be rejected
i.e. does it encompass 1?
Provides a plausible range of values for the population parameter
How precise the range of values are
Informationen
- Beschreibung
- Research Methods for Human Inquiry (Associations) Notiz am Variables and associations, erstellt von orange oranges am 16/03/2017.
- Erstellt von
- orange oranges
- Aufrufe
- 2
- Bewertung