34775102
Beschreibung
Quiz von Madison Skeel, aktualisiert more than 1 year ago
|
|
Erstellt von Madison Skeel
vor etwa 4 Jahre
|
|
Frage 1
Frage
The value of a parameter may change as the sample value changes.
Antworten
- True
- False
Frage 2
Frage
A type of research inference involves using a statistic to estimate a parameter
Antworten
- True
- False
Frage 3
Frage
The value of a statistic is fixed
Antworten
- True
- False
Frage 4
Frage
In theory, the value of a continuous variable may take any value in some interval of numbers
Antworten
- True
- False
Frage 5
Frage
A random sample guarantees a representative sample
Antworten
- True
- False
Frage 6
Frage
For an experiment, a researcher manipulates conditions under which observations are made
Antworten
- True
- False
Frage 7
Frage
A random sample maximizes the probability of obtaining a representative sample
Antworten
- True
- False
Frage 8
Frage
The science of statistics can be used to prove anything a researcher would like to prove
Antworten
- True
- False
Frage 9
Frage
For an observational study, a researcher merely records values of the dependent variable. That is, the researcher does not manipulate conditions under which observations are made.
Antworten
- True
- False
Frage 10
Frage
The value of a statistic may change as the sample changes
Antworten
- True
- False
Frage 11
Frage
Boxplots are a graphical display of the 5-number summary
Antworten
- True
- False
Frage 12
Frage
If two events A and B are disjoint, then A ∩ B = {0}
Antworten
- True
- False
Frage 13
Frage
For the data set consisting of the four numbers -3, -2, -2, -5, a valid measure of spread for all the data will be <0
Antworten
- True
- False
Frage 14
Frage
The sample mean x̄, is always the balance point of the relative frequency histogram for the data
Antworten
- True
- False
Frage 15
Frage
The sample median x̃, is always the balance point of the relative frequency histogram of the data
Antworten
- True
- False
Frage 16
Frage
A positive correlation between two quantitative variables X and Y implies that as one increases the other tends to decrease
Antworten
- True
- False
Frage 17
Frage
A positive correlation between two quantitative variables X and Y implies that as one increases, the other tends to increase
Antworten
- True
- False
Frage 18
Frage
If two events are disjoint, then A U B = ϕ
Antworten
- True
- False
Frage 19
Frage
The probability of the sample space is less than 1 when the probability of all the events contained in the sample space is less than 1.
Antworten
- True
- False
Frage 20
Frage
The Standard Normal Curve is always symmetric around 0
Antworten
- True
- False
Frage 21
Frage
When two events A and B are independent, the
P (A and B) = P (A) X P (B)
Antworten
- True
- False
Frage 22
Frage
When Z~ N (0, 1), then P (Z ≤ -1.34) = P (Z > 1.34)
Antworten
- True
- False
Frage 23
Frage
When X~ N ( μ, σ), then x̄~ N ( μ, σ/√n)
Antworten
- True
- False
Frage 24
Frage
When two events A and B are independent, then
P (A ∩ B) = P (A) + P (B)
Antworten
- True
- False
Frage 25
Frage
The Rule of Thumb for independence when drawing without replacement from a population states when the sample size is ≤ 5% of the population size, we can assume the draws are independent
Antworten
- True
- False
Frage 26
Frage
H0: μ = 0 is only rejected when the p-value is > 0.05
Antworten
- True
- False
Frage 27
Frage
H1: μ ≠ 0 is only accepted when the p-value > 0.05.
Antworten
- True
- False
Frage 28
Frage
Suppose a 95% confidence interval for a population mean μ is given by (-17.32, 13.1). Then there is a 5% chance that μ will fall outside this interval.
Antworten
- True
- False
Frage 29
Frage
Suppose a 95% confidence interval for a population mean μ is given by (-17.32, 13.1). Then there is a 95% chance that μ will fall in this interval.
Antworten
- True
- False
Frage 30
Frage
If the sampled population is normal, then the sampling distribution of x̄ is normal when based on a random sample.
Antworten
- True
- False
Frage 31
Frage
The number of new projects started each month at a cancer research center for the last nine months are:
0, 6, 10, 10, 12, 12, 16, 30
The sample median x̃ for the data is given by:
Antworten
-
10
-
11
-
12
-
10.5
Frage 32
Frage
The number of new projects started each month at a cancer research center for the last nine months are:
0, 6, 10, 10, 12, 12, 16, 30
The IQR for the above data is:
Antworten
-
8
-
7
-
6
-
14
Frage 33
Frage
The number of new projects started each month at a cancer research center for the last nine months are:
0, 6, 10, 10, 12, 12, 16, 30
Based on our Rule of Thumb for outliers, the following holds:
Antworten
-
There are no outliers
-
The minimum value is an outlier
-
The median value is an outlier
-
The maximum value is an outlier
Frage 34
Frage
Which of the following sets of numbers has the smallest possible variance?
Antworten
-
7, 8, 9, 10
-
-12, -12, -12, -12
-
0, 0, 10, 10
-
20, 23, 23, 30
Frage 35
Frage
The variance of 11 measurements of newborn height's (measured in inches) is computed to be 4 with a sample mean height of 20.
The units for the sample mean are:
Antworten
-
inches
-
square root inches
-
inches squared
-
no units, mean never has units
Frage 36
Frage
The variance of 11 measurements of newborn height's (measured in inches) is computed to be 4 with a sample mean height of 20.
The standard deviation of these measurements is:
Antworten
-
16
-
2
-
4
-
8
Frage 37
Frage
The units for the variance are
Antworten
-
inches
-
square root inches
-
inches squared
-
no units, variance never has units
Frage 38
Frage
Volunteers for a research study were divided into three groups. Group 1 listened to Western religious music, Group 2 listened to Western rock music, and Group 3 listened to Chinese religious music. The blood pressure of each volunteer was measured before and after listening to the music, and the change in blood pressure was recorded. The scatterplot is given below
What does the scatterplot suggest about the correlation between change in blood pressure and type of music?
Image:
Img 5819 (Einbetten)
Antworten
-
It is strongly negative
-
It is strongly positive
-
It is first strongly negative and then strongly positive
-
None of the above
Frage 39
Frage
Volunteers for a research study were divided into three groups. Group 1 listened to Western religious music, Group 2 listened to Western rock music, and Group 3 listened to Chinese religious music. The blood pressure of each volunteer was measured before and after listening to the music, and the change in blood pressure was recorded. The scatterplot is given below
What could we do to explore the relationship between type of music and change in blood pressure?
Image:
Img 5819 (Einbetten)
Antworten
-
See if blood pressure decreases as type of music increases by examining a scatterplot
-
Make a histogram of the change in blood pressure for all of the volunteers
-
Make side-by-side boxplots of the change in blood pressure, with a separate boxplot for each group
-
Do all of the above
Frage 40
Frage
Events A, B, and C represent all possible outcomes of an experiment. That is, the sample space is given by S= {A, B, C}.
Which of the following does not have to be true?
Antworten
-
0 ≤ P(A) ≤1 0 ≤ P(B) ≤ 1 0 ≤ P(C) ≤ 1
-
P ({A, B, C}) =1
-
P(A) + P(B) + P(C) =1
-
P(A) = P(B) = P(C) = 1/3
Frage 41
Frage
A fair coin is tossed two times in succession and the following events are defined:
A: {Observes at least one head}
B: {Observe exactly two heads}
C: {Observe exactly one head}
The sample space for this experiment is given by:
Antworten
-
{H, T}
-
{HH, HT, TH, TT}
-
{HH, TT}
-
{H-T}
Frage 42
Frage
A fair coin is tossed two times in succession and the following events are defined:
A: {Observes at least one head}
B: {Observe exactly two heads}
C: {Observe exactly one head}
Using classical assignment of probability, the P(C) is:
Antworten
-
1/4
-
3/4
-
2/4
-
1
Frage 43
Frage
Three experimental groups representing fitness levels for a random sample of U.S. men aged 35-45 were determined. The following chart represents the boxplots for the variable resting heart rate:
Which experimental group has the largest IQR?
Antworten
-
Experimental group 0
-
Experimental group 1
-
Experimental group 2
-
Unable to determine using boxplots
Frage 44
Frage
Which of the following recorded variables is continuous?
Antworten
-
Town of residence of a randomly selected college student
-
Number of people, both adults and children, living in a randomly selected U.S. household
-
Total household income (number of dollars per year), before taxes, in 2010 of a randomly selected U.S. household
-
Age, in years, of a randomly selected U.S. college student
Frage 45
Frage
Which of the following recorded variables is categorical?
Antworten
-
Size of town of residence, measured as "small" for sizes ≤ 70,000; or "large" for sizes > 70,000 for a randomly selected U.S. college student
-
Number of residents per household working outside the home for a randomly selected U.S. household
-
The number of residents for a randomly selected U.S household
-
Age, in years, of a randomly selected U.S. college student
Frage 46
Frage
Which of these variables is categorical?
Antworten
-
The race time (in minutes) of a randomly selected participant in the 2013 New York City marathon
-
The number of animals within a randomly selected geographical area
-
Whether randomly selected competitors in a running contest win or lose
-
The total number of contests won by randomly selected competitors for the year 2012
Frage 47
Frage
Does ginkgo biloba enhance memory? In a study to find out, 100 adult subjects who take ginkgo biloba once a day were randomly selected and 100 adults who do not take ginkgo biloba were randomly selected. Each group was given a memory test. The average score for the ginkgo biloba group was 82.78 and for the no-ginkgo group the average score was 73.46
The population(s) of interest are:
Antworten
-
All adults
-
All adults who take ginkgo biloba once a day; all adults who do not take ginkgo biloba
-
All adults who take ginkgo biloba once a day
-
none of the above
Frage 48
Frage
Does ginkgo biloba enhance memory? In a study to find out, 100 adult subjects who take ginkgo biloba once a day were randomly selected and 100 adults who do not take ginkgo biloba were randomly selected. Each group was given a memory test. The average score for the ginkgo biloba group was 82.78 and for the no-ginkgo group the average score was 73.46
The parameters of interest for this study are:
Antworten
-
Whether a person take ginkgo biloba or not
-
the memory test scores
-
the average test score for all adults who take ginkgo biloba and for all adults who do not take ginkgo biloba
-
the percentage of adults who take ginkgo biloba and the percentage of adults who do not take ginkgo biloba
Frage 49
Frage
Does ginkgo biloba enhance memory? In a study to find out, 100 adult subjects who take ginkgo biloba once a day were randomly selected and 100 adults who do not take ginkgo biloba were randomly selected. Each group was given a memory test. The average score for the ginkgo biloba group was 82.78 and for the no-ginkgo group the average score was 73.46
The dependent variable for this study is given by:
Antworten
-
whether a person take ginkgo biloba or not
-
the memory test scores
-
the average test scores for all adults who take ginkgo biloba and for all adults who do not take ginkgo biloba
-
the percentage of adults who take ginkgo biloba and the percentage of adults who do not take ginkgo biloba
Frage 50
Frage
Does ginkgo biloba enhance memory? In a study to find out, 100 adult subjects who take ginkgo biloba once a day were randomly selected and 100 adults who do not take ginkgo biloba were randomly selected. Each group was given a memory test. The average score for the ginkgo biloba group was 82.78 and for the no-ginkgo group the average score was 73.46
The statistics calculated for this study are:
Antworten
-
the sample averages 82.78 and 73.46
-
the average test scores for all adults who take ginkgo biloba and for all adults who don't take ginkgo biloba
-
the percentage of adults who take ginkgo biloba and the percentage of adults who do not take ginkgo biloba
-
none of the above
Frage 51
Frage
Does ginkgo biloba enhance memory? In a study to find out, 100 adult subjects who take ginkgo biloba once a day were randomly selected and 100 adults who do not take ginkgo biloba were randomly selected. Each group was given a memory test. The average score for the ginkgo biloba group was 82.78 and for the no-ginkgo group the average score was 73.46
Is the claim "ginkgo biloba causes memory improvement" supported by this study?
Antworten
-
Yes, because random samples were obtained and the average scores for the no-ginkgo group were lower
-
No, because memory test scores can only be recorded as a categorical variable
-
Yes, because there is evidence that the average memory test score for the population of ginkgo taking adults is higher than the average memory test score for the population of no-ginkgo taking adults
-
No, because this is an observational study with possible confounding factors, such as genetics
Frage 52
Frage
The Gallup survey organization obtained a random sample of 2,527 U.S. citizens. The proportion in the sample who favored a constitutional amendment that would define marriage as being between a man and a woman was 1289/2527 = 51%
The population of interest consists of:
Antworten
-
All of the 2527 citizens sampled
-
All U.S. college students
-
All U.S. citizens who favor the amendment
-
All U.S. citizens
Frage 53
Frage
The Gallup survey organization obtained a random sample of 2,527 U.S. citizens. The proportion in the sample who favored a constitutional amendment that would define marriage as being between a man and a woman was 1289/2527 = 51%
The percentage of the 2527 citizens who favor the amendment is an example of:
Antworten
-
parameter value
-
a statistic
-
census with respect to amendment
-
qualitative, continuous variable
Frage 54
Frage
The Gallup survey organization obtained a random sample of 2,527 U.S. citizens. The proportion in the sample who favored a constitutional amendment that would define marriage as being between a man and a woman was 1289/2527 = 51%
The dependent variable is:
Antworten
-
a discrete quantitative variable
-
a categorical variable
-
a continuous quantitative variable
-
a discrete categorical variable
Frage 55
Frage
A study was conducted to determine the effect of a new low-density lipoprotein (LDL) cholesterol lowering drug compared to the currently prescribed drug. 5000 U.S. adults aged 45-65 with "high" LDL cholesterol (> 130 milligrams per deciliter (mg/dL)) were randomly selected. 2500 of the adults were randomly assigned to the new drug group and 2500 of the adults were randomly assigned to the control (currently prescribed) drug group. At the end of the 1-year study period, the average LDL cholesterol level for the 2500 patients in the new drug group was 112 mg/dL and the average LDL cholesterol level for the control drug group was 125 mg/dL.
What are the population(s) of interest for this study?
Antworten
-
All U.S. adults age 45-65
-
All U.S. adults age 45-65 with high LDL cholesterol and all U.S. adults age 45-65 with normal LDL cholesterol
-
All U.S adults age 45-65 with high LDL cholesterol who take the new drug and all U.S. adults age 45-65 with high LDL cholesterol who take the control drug
-
All U.S. adults with high LDL cholesterol
Frage 56
Frage
A study was conducted to determine the effect of a new low-density lipoprotein (LDL) cholesterol lowering drug compared to the currently prescribed drug. 5000 U.S. adults aged 45-65 with "high" LDL cholesterol (> 130 milligrams per deciliter (mg/dL)) were randomly selected. 2500 of the adults were randomly assigned to the new drug group and 2500 of the adults were randomly assigned to the control (currently prescribed) drug group. At the end of the 1-year study period, the average LDL cholesterol level for the 2500 patients in the new drug group was 112 mg/dL and the average LDL cholesterol level for the control drug group was 125 mg/dL.
What is the dependent variable?
Antworten
-
Drug, measured as taking new drug or control drug
-
age, measured in years
-
LDL cholesterol > 130 mg/dL
-
LDL cholesterol after 1-year, measure in mg/dL
Frage 57
Frage
A study was conducted to determine the effect of a new low-density lipoprotein (LDL) cholesterol lowering drug compared to the currently prescribed drug. 5000 U.S. adults aged 45-65 with "high" LDL cholesterol (> 130 milligrams per deciliter (mg/dL)) were randomly selected. 2500 of the adults were randomly assigned to the new drug group and 2500 of the adults were randomly assigned to the control (currently prescribed) drug group. At the end of the 1-year study period, the average LDL cholesterol level for the 2500 patients in the new drug group was 112 mg/dL and the average LDL cholesterol level for the control drug group was 125 mg/dL.
What type of variable is the dependent variable?
Antworten
-
A quantitative, discrete variabel
-
A quantitative, continuous variable
-
A categorical, discrete variable
-
A categorical, continuous variable
Frage 58
Frage
A study was conducted to determine the effect of a new low-density lipoprotein (LDL) cholesterol lowering drug compared to the currently prescribed drug. 5000 U.S. adults aged 45-65 with "high" LDL cholesterol (> 130 milligrams per deciliter (mg/dL)) were randomly selected. 2500 of the adults were randomly assigned to the new drug group and 2500 of the adults were randomly assigned to the control (currently prescribed) drug group. At the end of the 1-year study period, the average LDL cholesterol level for the 2500 patients in the new drug group was 112 mg/dL and the average LDL cholesterol level for the control drug group was 125 mg/dL.
What type of variable is the independent variable drug?
Antworten
-
A quantitative, discrete variable
-
A quantitative, continuous variable
-
A categorical, discrete variable
-
A categorical variable
Frage 59
Frage
A study was conducted to determine the effect of a new low-density lipoprotein (LDL) cholesterol lowering drug compared to the currently prescribed drug. 5000 U.S. adults aged 45-65 with "high" LDL cholesterol (> 130 milligrams per deciliter (mg/dL)) were randomly selected. 2500 of the adults were randomly assigned to the new drug group and 2500 of the adults were randomly assigned to the control (currently prescribed) drug group. At the end of the 1-year study period, the average LDL cholesterol level for the 2500 patients in the new drug group was 112 mg/dL and the average LDL cholesterol level for the control drug group was 125 mg/dL.
The statistics calculated for this study are:
Antworten
-
The average LDL cholesterol levels for both the high and normal populations
-
The average LDL cholesterol levels given by 112 mg/dL and 125 mg/dL
-
The average LDL cholesterol level for all U.S. adults
-
Percent with "high" cholesterol for both the 2500 patients prescribed the new drug and the 2500 patients prescribed the control drug
Frage 60
Frage
A study was conducted to determine the effect of a new low-density lipoprotein (LDL) cholesterol lowering drug compared to the currently prescribed drug. 5000 U.S. adults aged 45-65 with "high" LDL cholesterol (> 130 milligrams per deciliter (mg/dL)) were randomly selected. 2500 of the adults were randomly assigned to the new drug group and 2500 of the adults were randomly assigned to the control (currently prescribed) drug group. At the end of the 1-year study period, the average LDL cholesterol level for the 2500 patients in the new drug group was 112 mg/dL and the average LDL cholesterol level for the control drug group was 125 mg/dL.
The parameters of interest in this study are:
Antworten
-
The average LDL cholesterol levels for both the high and normal populations
-
The average LDL cholesterol levels for both the new drug and the control drug populations after one year of taking the respective drug
-
The average LDL cholesterol levels for all U.S. adults
-
Percent with "high" cholesterol in the population of adults age 45-65
Frage 61
Frage
A study was conducted to determine the effect of a new low-density lipoprotein (LDL) cholesterol lowering drug compared to the currently prescribed drug. 5000 U.S. adults aged 45-65 with "high" LDL cholesterol (> 130 milligrams per deciliter (mg/dL)) were randomly selected. 2500 of the adults were randomly assigned to the new drug group and 2500 of the adults were randomly assigned to the control (currently prescribed) drug group. At the end of the 1-year study period, the average LDL cholesterol level for the 2500 patients in the new drug group was 112 mg/dL and the average LDL cholesterol level for the control drug group was 125 mg/dL.
The research inference of interest is given by:
Antworten
-
The average LDL cholesterol is lower when the new drug is administered
-
The new drug sample average LDL cholesterol < the control drug sample LDL cholesterol, thus estimate the new drug population average LDL cholesterol < the control drug population LDL cholesterol
-
The sample average LDL cholesterol < 130, thus estimate the population LDL cholesterol < 130
-
The new drug is effective for lowering LDL cholesterol
Frage 62
Frage
A study was conducted to determine the effect of a new low-density lipoprotein (LDL) cholesterol lowering drug compared to the currently prescribed drug. 5000 U.S. adults aged 45-65 with "high" LDL cholesterol (> 130 milligrams per deciliter (mg/dL)) were randomly selected. 2500 of the adults were randomly assigned to the new drug group and 2500 of the adults were randomly assigned to the control (currently prescribed) drug group. At the end of the 1-year study period, the average LDL cholesterol level for the 2500 patients in the new drug group was 112 mg/dL and the average LDL cholesterol level for the control drug group was 125 mg/dL.
The design of this study is given by:
Antworten
-
An experiment without random assignment
-
An observational study without random assignment
-
An experiment with random assignment to groups
-
An observational study with random assignment to groups
Frage 63
Frage
The legal profession conducted a study to determine the percentage of cardiologists who had been sued for malpractice in the last five years. The sample was randomly chosen from a national directory of doctors.
What is the dependent variable of interest in this study?
Antworten
-
The doctor's area of expertise
-
The number of doctors who are cardiologists
-
The responses: have been sued/have not been sued for malpractice in the last five years
-
All cardiologists in the directory
Frage 64
Frage
Ignoring twins and other multiple births, assume babies born at a hospital are independent events with the probability that a baby is a boy and the probability that a baby is a girl both equal to 0.5
What is the probability that the next two babies are of the same sex?
Antworten
-
0.25
-
0.75
-
1.0
-
0.50
Frage 65
Frage
Ignoring twins and other multiple births, assume babies born at a hospital are independent events with the probability that a baby is a boy and the probability that a baby is a girl both equal to 0.5
Define the events A = { the next two babies are boys}, and
B = { the next two babies are girls}. What do we know about events A and B?
Antworten
-
They are symmetric
-
They are complements
-
They are independent
-
None of the above
Frage 66
Frage
Draws made with replacement are:
Antworten
-
independent
-
dependent
-
not independent
-
none of the above
Frage 67
Frage
Draws made without replacement are:
Antworten
-
independent
-
dependent
-
not dependent
-
none of the above
Frage 68
Frage
In the last mayoral election in a large city, 47% of the adults over the age of 65 voted Republican. A researcher wishes to determine if the proportion of adults over the age of 65 in the city who plan to voted Republican in the next mayoral election has changed. Let p represent the proportion of the population of all adults over the age of 65 in the city who plan to vote Republican in the next mayoral election. In terms of p, the researcher should test which of the following null and alternative hypotheses?
Antworten
-
Ho: p= 0.47 vs. H1: p< 00.47
-
Ho: p= 0.47 vs. H1: p≠ 0.47
-
Ho: p= 0.47 vs. H1: p> 0.47
-
none of the above
Frage 69
Frage
The resting pulse rate for all runners in the New York City marathon for 2013 has a mean of μ = 70 and standard deviation of σ = 3. Suppose 49 runners are randomly selected from this population.
The distribution of x̄, the sample average resting pulse rate, is given by:
Antworten
-
x̄ ~ N (70, 3) by CLT
-
x̄ ~ N (3, 70) by CLT
-
x̄ ~ N (70, 3/7) by result (1)
-
x̄ ~ N (70, 3/7) by CLT
Frage 70
Frage
The resting pulse rate for all runners in the New York City marathon for 2013 has a mean of μ = 70 and standard deviation of σ = 3. Suppose 49 runners are randomly selected from this population.
Find the probability that the sample average pulse rate of the 49 runners exceeds 70.86.
Antworten
-
0.9772
-
0.4772
-
0.3859
-
0.0228
Frage 71
Frage
The power of a test of hypotheses is defined as:
Antworten
-
P(conclude H1| H1 is true)
-
P(conclude H1 | Ho is true)
-
P(conclude Ho | H1 is true)
-
P(conclude Ho | Ho is true)
Frage 72
Frage
You have measured the systolic blood pressure of a random sample of 80 employees of a large company located near you. You use the default confidence interval formula of a statistical software package to calculate a 95% confidence interval for the mean systolic blood pressure for all employees of this company ( denoted by μ). The calculated confidence interval is (122, 138)
What requirements are necessary for this confidence interval to be valid?
Antworten
-
The sample mean equals the population mean
-
The sample was randomly selected from an approximately normal population
-
The population mean has an approximate normal distribution
-
A random sample and the sampling distribution of the sample mean given by x̄ ~ N (μ , σ/√80)
Frage 73
Frage
You have measured the systolic blood pressure of a random sample of 80 employees of a large company located near you. You use the default confidence interval formula of a statistical software package to calculate a 95% confidence interval for the mean systolic blood pressure for all employees of this company ( denoted by μ). The calculated confidence interval is (122, 138)
Which of the following statements gives a valid interpretation of the phrase "95% confident μ is in the interval (122, 138)?
Antworten
-
95% of the population of employees have a systolic blood pressure between 122 and 138
-
The method used to obtain the interval has a 95% chance of producing and interval that contains the population mean and systolic blood pressure
-
The probability that the population mean blood pressure is between 122 and 138 is 0.95
-
Both B and C
Frage 74
Frage
Suppose the resting pulse rate for all runners in the 2015 New York City marathon a week after the event has a mean of μ = 70 and a standard deviation of σ = 3. Supposed 64 runners will be randomly selected from this population
The distribution of x̄, the sample average resting pulse rate, is given by:
Antworten
-
x̄ ~ N (70, 3) by CLT
-
x̄ ~ N (3, 70) by CLT
-
x̄ ~ N (70, 3/8) because the sampled population is normal
-
x̄ ~ N (70, 3/8) by CLT
Frage 75
Frage
Suppose the resting pulse rate for all runners in the 2015 New York City marathon a week after the event has a mean of μ = 70 and a standard deviation of σ = 3. Supposed 64 runners will be randomly selected from this population
Find the probability that the sample average resting pulse rate of the 64 runners is less than 70.9375
Antworten
-
0.9938
-
0.4522
-
0.5478
-
0.0062
Frage 76
Frage
Suppose that A and B are two independent events. The probability that event A occurs in 0.4 (i.e. P(A) = 0.4), and that B occurs is P(B) = 0.2. What is the probability that both A and B occur?
Antworten
-
0.08
-
0.60
-
0.52
-
0.40
Frage 77
Frage
A random sample of size n = 36 is to be drawn from a population with μ = 500 and σ = 200. What is the probability that the sample mean exceeds 400?
Antworten
-
0.6915
-
Approximately 0
-
0.3085
-
0.9987
Frage 78
Frage
The scores of individual students interested in majoring in a Health Science program on the American College Testing (ACT) Program Composite College Entrance Examination are normally distributed with a mean of 18.6 and standard deviation of 6.0.
Find the proportion of scores that are greater than 33.6
Antworten
-
0.0062
-
0.9938
-
0.0228
-
0.8413
Frage 79
Frage
The scores of individual students interested in majoring in a Health Science program on the American College Testing (ACT) Program Composite College Entrance Examination are normally distributed with a mean of 18.6 and standard deviation of 6.0.
Find the proportion of scores falling in the interval [12.42, 31.2]
Antworten
-
0.8234
-
0.1515
-
-0.8234
-
0.8306
Frage 80
Frage
The scores of individual students interested in majoring in a Health Science program on the American College Testing (ACT) Program Composite College Entrance Examination are normally distributed with a mean of 18.6 and standard deviation of 6.0.
Find the proportion of scores that are less than 4.02
Antworten
-
0.0075
-
0.9925
-
0.9918
-
0.0082
Frage 81
Frage
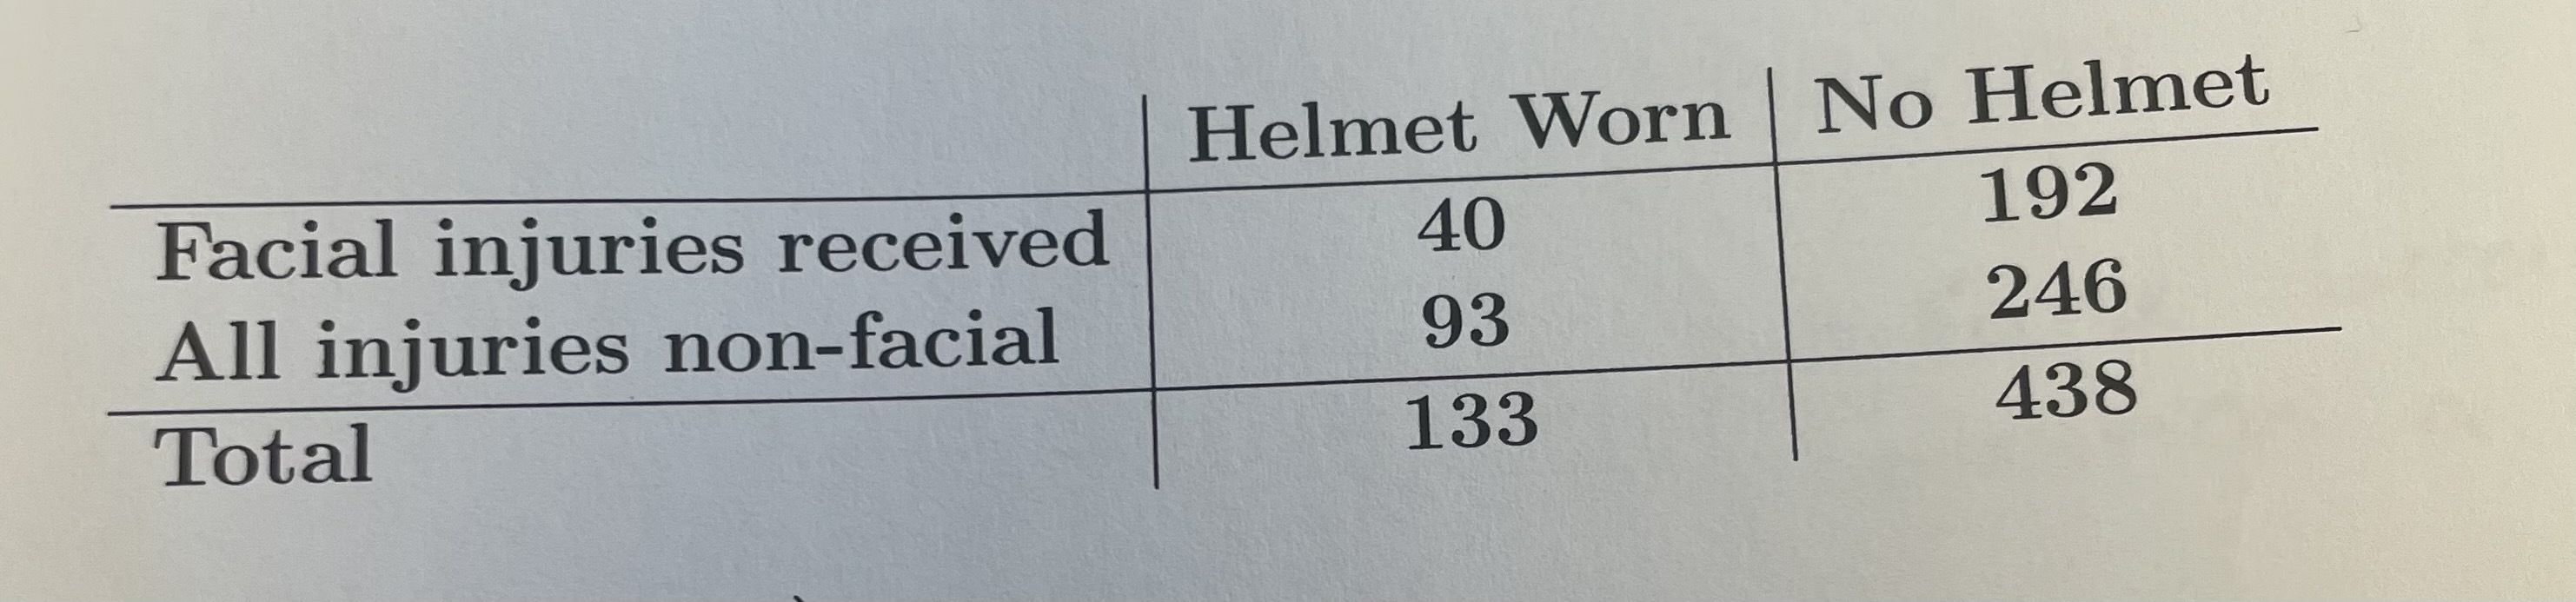
The attached table provides data from "A Case-Control Study of the Effectiveness of Bicycle Safety Helmets in Preventing Facial Injury"
For the group that did not wear helmets, find the risk for facial injury
Antworten
-
0.78
-
0.44
-
0.27
-
0.16
Frage 82
Frage
The attached table provides data from "A Case-Control Study of the Effectiveness of Bicycle Safety Helmets in Preventing Facial Injury"
For those who did not wear helmets, find the odds of facial injuries to non-facial injuries
Antworten
-
0.78
-
0.44
-
0.43
-
0.16
Frage 83
Frage
The attached table provides data from "A Case-Control Study of the Effectiveness of Bicycle Safety Helmets in Preventing Facial Injury"
Find the odds ratio for facial injuries in the group that did not wear helmets to the group that did wear helmets
Antworten
-
0.78
-
1.36
-
0.16
-
1.81
Möchten Sie mit GoConqr kostenlos Ihre eigenen Quiz erstellen? eigenen Mehr erfahren.