Chapter 7: Investigating Data

Description

8 Maths Mind Map on Chapter 7: Investigating Data, created by Sarah L on 27/07/2015.
Sarah L
Mind Map by Sarah L, updated more than 1 year ago
Sarah L
Created by Sarah L over 8 years ago
137
5

Resource summary

Chapter 7: Investigating Data
  1. Mean and mode
    1. mean = sum of scores/ number of score
      1. Mode=most frequent score
      2. Organising and displaying data
        1. Graphs
          1. Column
            1. Secto
            2. Tables
              1. Charts
                1. Pie chart
              2. Types of Data
                1. Categorical
                  1. Groups in categories
                  2. Numerical
                    1. Numbers
                      1. Discrete
                        1. distinct values
                        2. Contiuous
                          1. not exact
                            1. decimal points
                      2. Median and range
                        1. median= middle score( in order)
                          1. range= highest score- lowest score
                          2. Analysing frequency tables
                            1. fx colum= score x frequency
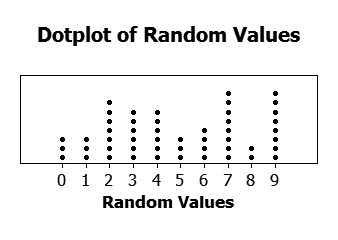
                            2. Dot plots and Stem and leaf plots
                              1. Dot plots show cluster and outliers
                                1. Stem and lea plots show modes, clusters and how the scores are spread out
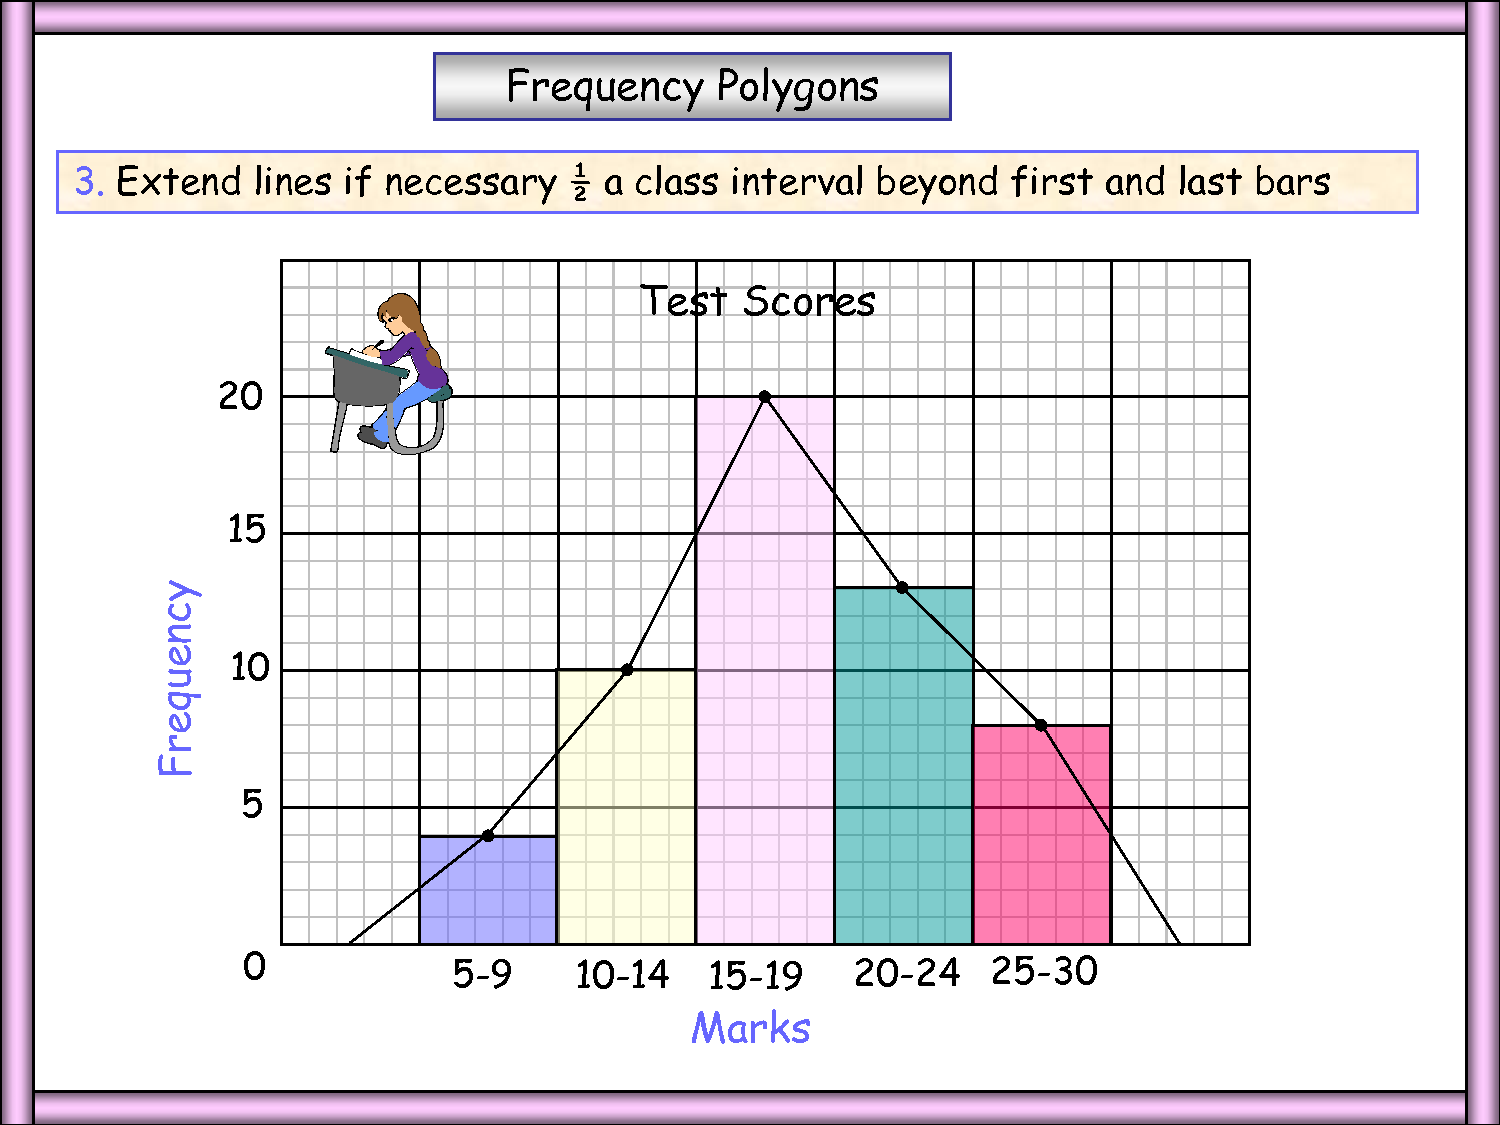
                                2. Frequency histograms and ploygons
                                  1. Sampling
                                    1. Sample
                                      1. selection of people
                                      2. Census
                                        1. whole population
                                        2. random sample
                                          1. NOT biased
                                            1. =not opiniated questions
                                        3. Designing survey questions
                                          1. simple
                                            1. not biased
                                              1. easy to answer
                                                1. not too long
                                                2. Analysing data
                                                  1. Mean
                                                    1. affected by outliers
                                                      1. *best when no outliers
                                                      2. Mode
                                                        1. not affected by outliers
                                                          1. *best when most common score is needed
                                                          2. Median
                                                            1. not affected by outliers
                                                              1. *when data has outliers
                                                              2. Range
                                                                1. *when a measure of spread is needed
                                                              Show full summary Hide full summary

                                                              Similar

                                                              Statistics, Data and Area (Semester 2 Exam)
                                                              meg willmington
                                                              The Exponential Model
                                                              katie.barclay
                                                              TYPES OF DATA
                                                              Elliot O'Leary
                                                              Statistics Key Words
                                                              Culan O'Meara
                                                              STEM AND LEAF DIAGRAMS
                                                              Elliot O'Leary
                                                              CUMULATIVE FREQUENCY DIAGRAMS
                                                              Elliot O'Leary
                                                              FREQUENCY TABLES: MODE, MEDIAN AND MEAN
                                                              Elliot O'Leary
                                                              HISTOGRAMS
                                                              Elliot O'Leary
                                                              Fractions and percentages
                                                              Bob Read
                                                              GCSE Maths Symbols, Equations & Formulae
                                                              Andrea Leyden
                                                              GCSE Maths: Geometry & Measures
                                                              Andrea Leyden