
Apuntes
3003PSY Stats Notes
Contenido del apunte (14)
Página 1
Week 1
CHARACTERISTICS OF GOOD PSYCHOLOGICAL RESEARCH
Guided by theory
Standardised procedures
Generalisable- internal and external validity
Reliable
Uses multiple methods including experimental, correlational and descriptive research
The twin tools of science
Research methodology
The collection of approaches, paradigms and procedures (real or logical) that give us confidence in whatever data we gather
Statistical analysis
Algorithms with which we process our (usually quantitative) data to help us to arrive at a conclusion… • … about our research question
Name your assumptions
We believe that our constructed world is a system of integrated causes and effects
We believe that carefully planned and executed empirical research can help us ultimately to uncover these - not everyone thinks so
We believe that it is feasible to assign numbers (in most cases) to measure these
We are willing to make certain assumptions about the numbers (representing the causes and effects) and their relationships.
Statistical procedures are a limited set of mathematicallyderived tools used in modelling research questions, taking our numbers as input
Statistics are decision aids
Doing research
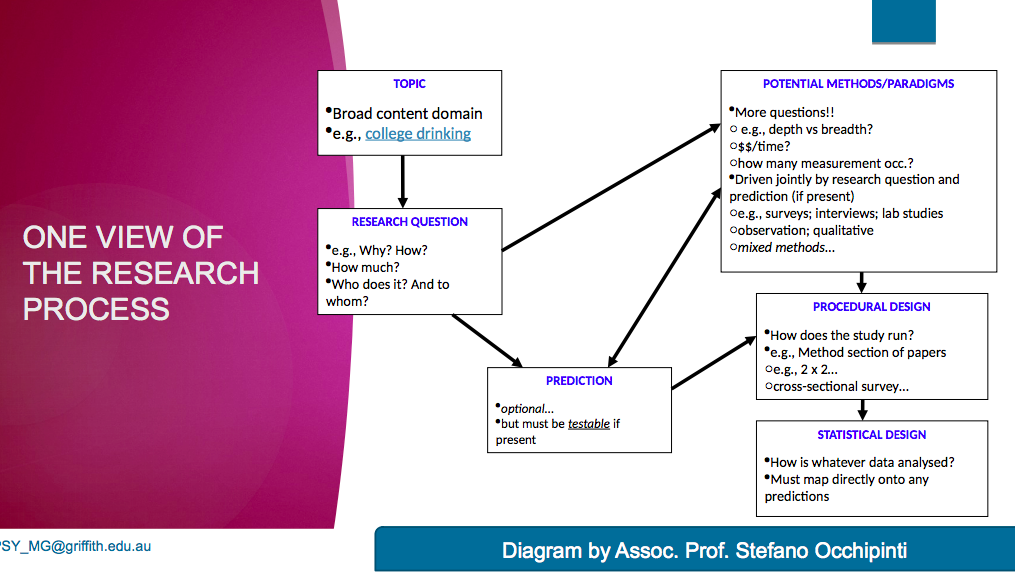
Researchers begin with a question usually derived from a topic area of particular interest
The research question guides and shapes the rest of the process It may push us to choose a particular set of methods
E.g., a survey vs an experiment; a probability sample vs a convenience sample
The statistics will follow from this as well
Research Question
Basic question researcher wants to answer
Often, there is more than one research question.
Precedes any predictions
Think in terms like:
How? How much? Who? Why?
How does drinking change across first year?
What are the correlates of college drinking?
What are the predictors of college drinking?
Each of these suggests different approaches to sampling, study design and analysis…
Predictions:
These must be testable
Some state of the world that data will address
Our models of science based on falsification Hypotheses should be falsifiable It is not always the case that we make a prediction… …but often, we have enough empirical data and theory to guide us and so we do make one You can’t just opt out of your own accord…
Design
Really, it splits up into the procedural part this is probably what you thought of as “The design”
E.g., 2 x 2 experimental study
A mailout survey (or an online survey)
The statistical part
Many statistics that you have learned are tied intimately to a design but not always so Important to understand this as we ask more complex, real-world (!) questions
Página 2
Week 2
Questions:
1. Research question
What is the research question and what type of question is it?
What is the significance of the research question?
2. A prediction
What is/are the prediction(s) of the study (where appropriate)?
3. A way (design and/or procedure) to test it
Will the design be experimental or correlational, or a mixture?
true- or quasi- experimental, correlational?
Cross-sectional or longitudinal?
How will each variable be manipulated/measured?
Most importantly, is the type of design/procedure appropriate to the Research Question— are there any other approaches or paradigms that might work as well, or better?
Are there likely to be hidden issues, such as retrospective data etc.?
Outline the procedures you would employ
How will each variable be manipulated/measured?
Are there any constraints imposed by the social or political/ethical context?
Is it clear how the intended design will provide data to test the prediction?
How long would it take to run the study?
CONSTRUCTS, VARIABLES, & MEASUREMENT
Surveys are a particular form of non-experimental data gathering
As almost all of the key variables in survey approaches are measured and not manipulated experimentally, we need to spend a lot more time focusing on how to get reliable and valid measures
Considering best ways to tap constructs
Many different ways: behaviours, peer or self reports etc
CONSTRUCTS-VARIABLES-OPERATIONS
Attitudes Toward Statistics - is an abstract concept
We construct construct the idea of the thing—does not exist by itself the idea of the thing—does not exist by itself
not directly observable - construct
e.g., attitude, parenting skill, anxiety, personality traits
We use measures we believe will tap the constructs
e.g., self-report measures, Explicit attitude scale; psychophysiological measures etc
These are our variables
We create scores from the measures create scores from the measures
e.g., total score on a perfectionism scale, the averaged output of psychophysiology
measures are all operations or operational definitions
operation = where do the actual numbers (in SPSS) come from?
Goodness of measures:
Need to be able to trust our measurements, or our results can be brushed aside immediately
This involves matters of degree and it is formalised as reliability and validity
it’s not a black and white judgement
reliability based on random error
validity based on coverage of correct underlying construct
All we have are the observed scores…
COMPONENTS OF OBSERVED SCORES
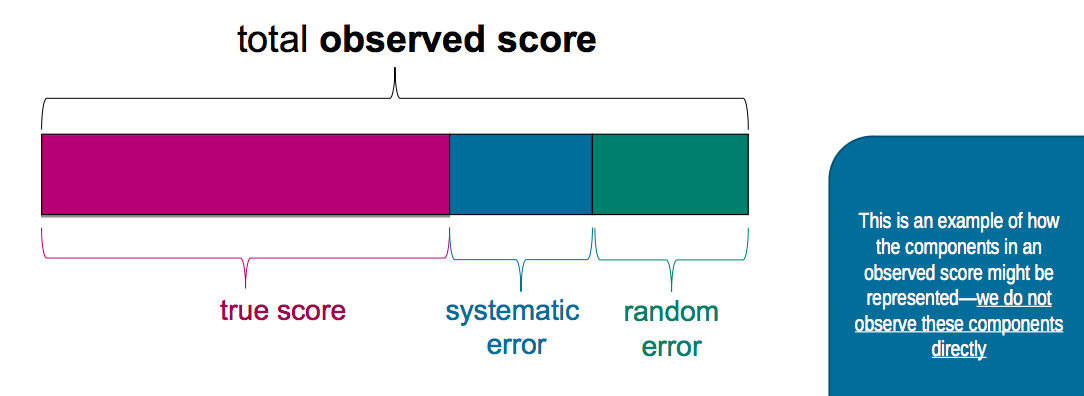
Any time a measurement is made it is influenced by a range of factors—it represents 3 things
The systematic effect of the underlying construct [true score]
e.g., how much I actually know stats
E.g., should be unchanging across occasions without some treatment to increase (or decrease) it
Unrelated but systematic factors [systematic error]
e.g., how well I perform in testing situations in general
People with low test anxiety systematically better than high test anxiety people
Chance, changeable factors [random error]
Whether or not I happened to get little sleep one night at random
Measurement
The reliability and validity of survey measures is the basis on which all of this rests and must be uppermost in our minds as we design measures and variables.
All we have to start with is well chosen and operationalised measures!
In particular, the more systematic and random error there is in our measures, the harder it is to make any sort of inference
We need to maximise (or better, optimise) the amount of true score in our measures
Reliabilty and Validity
Reliability:
Test-retest reliability - the stability of the measurement across time
Determined by administering the same measure on two occasions and looking at the correlation between the scores.
The more stable the measure, the stronger the correlation.
The time frame between testing can vary from several days to several years, depending on the construct being measured.
For instance, scores on an intelligence test taken in adulthood should remain stable over the years, whereas scores on a reading or vocabulary test will change rapidly during early childhood.
Internal consistency - the extent to which items on a measure assess the same construct
A measure needs to be internally consistent.
Items measuring a construct should correlate strongly with each other.
There are a number of ways to assess internal consistency.
One frequently used method is referred to as split-half reliability.
An instrument is administered and divided into halves that are scored separately. One half of the test can then be correlated with the other.
An alternative method used for determining an instrument’s internal consistency is the use of a statistic known as Cronbach's alpha, which is based on the average correlation of all the possible split-halves within a test.
The recommended minimal criterion for an alpha coefficient is .7.
Inter-rater reliability - the level of agreement between two or more raters
Inter-rater reliability is relevant to assessments in which two or more trained observers arrive at some conclusion, such as diagnosis.
Although there are a variety of coefficients assessing inter-rater reliability, the most commonly used coefficient is the Kappa statistic, which measures the level of agreement between two or more observers on categorical outcomes (e.g., illness/no illness).
Kappas range from 0-1, with coefficients closer to 1 indicating that two observers agree more often than chance. Generally a Kappa of .70 or greater is considered acceptable.
Intra-class correlations (ICC) are also frequently used for agreement on measures that derive a score rather than a categorical decision.
Validity:
Content Validity
An measure is considered to have content validity if it measures all aspects of the construct of interest.
Construct Validity
Construct validity requires that the measure assesses only those characteristics of the construct it was designed to measure.
Two related forms of construct validity are convergent and discriminant validity.
Convergent validity is established when the measure correlates highly with other tests or methods of measuring the same construct.
For example, a self-report measure of depression should correlate highly with a clinician’s assessment of depression or with another established measure of depression
Discriminant validity is established in the presence of low correlations between the measure and measures of other unrelated constructs.
For example the above measure of depression should not correlate with a measure of intelligence.
Criterion Validity
Criterion validity refers to the extent to which it corresponds to another accurate measure of the construct. This can be tested at a single point in time - concurrent validity or as a predictor of future outcomes - predictive validity.
Concurrent validity refers to the relationship between scores on the measure of interest and another measure of the same construct or a diagnosis at the same time.
For example a measure a depression severity should be associated with other standardised measures of depression or a major diagnostic system such as the DSM-IV.
Predictive validity is the extent to which an individual’s scores on a measure will accurately predict that individual’s future scores or behaviour.
For instance, a measure of hazardous alcohol use, in which high scores in adolescence consistently predict alcohol use problems in adulthood, would be considered to have predictive validity.
SAMPLING BIAS AND SAMPLING ERROR
Inferential Statistics - using sample data to make inferences about population parameters - if nothing else is known, the statistics of a sample (e.g., the mean) are the best estimates of the population parameters (e.g., height of Griffith students based on this class).
But samples may fail to provide good estimates of population for two reasons: (1) sampling bias and (2) sampling error
Sampling Bias:
Due to faulty sampling methods, some important subgroups of the population may be over- or under-represented in our sample
Systematic variation
A classic example…
American election in the 1948 Polls predicted the Republican candidate, Thomas Dewey would win
However, the Democrat, Harry S. Truman, won by a landslide
Avoidable through random sampling: Ideally, every member of target population should be equally likely to be selected for the sample
Sampling error:
the term ‘sampling error’ implies a mistake but this is misleading … it’s a natural thing and can’t be helped.
Think of this as sampling fluctuation
so the question is not whether the sample mean differs from the population mean (it almost always will) but how likely is it that the difference we observed could have occurred by chance
Sampling Distribution
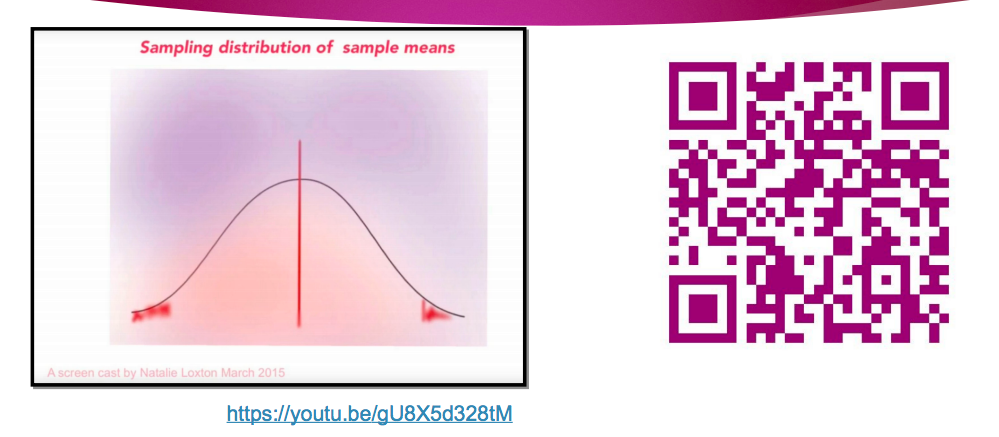
The distribution of a statistic that we would expect if we drew an infinite number of samples (of a given size) from the population
Sampling distributions have means and SDs
Can have a sampling distribution for any statistic, but the most common is the sampling distribution of the mean
In a future week we will discuss the sampling distribution of the correlation coefficient
Standard error of mean
standard error of the mean is the standard deviation of the distribution of sample means
it represents the typical or average distance between a sample mean and the mean of the population
it is used to define and accurately measure sampling error
Sampling distribution:
Página 3
Week 3
What is a survey:
Survey = set of questions tapping one or more constructs that are administered to a sample of participants. This is a survey study!
Unlike a lab study in which sampling considerations are given less weight, a survey study is heavily dependent on the sampling for validity—future weeks
a survey instrument tends to contain all measured variables, either continuous scales or attributes (nominal, ordinal)
Can be administered once (cross-sectional) or more than once to the same people (panel or longitudinal, if linked)
also various combinations and cohort designs
Can be interviews
Can be written
Self-report measures
Conducting a survey study:
What is/are my research question(s)??
What is my budget in $$ and time?
Cost is a big driver in research data gathering
Online = cheapest, Face to Face = most expensive
Cost is correlated fairly well with response rate, sample quality and Participants’motivation
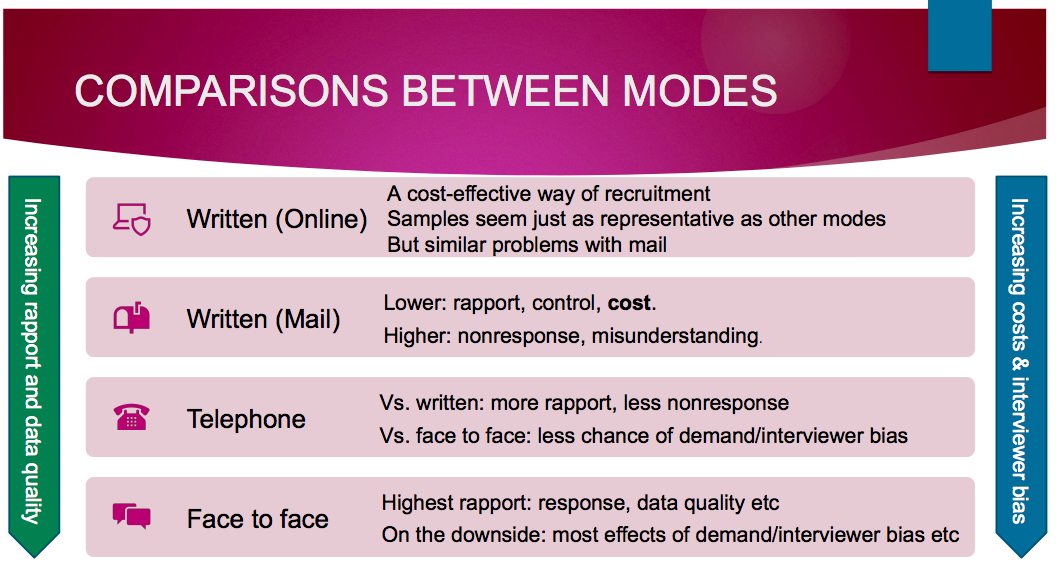
Comparison between modes:
Written (Online)
A cost-effective way of recruitment
Samples seem just as representative as other modes
But similar problems with mail
Written (Mail)
Lower: rapport, control, cost.
Higher: nonresponse, misunderstanding
Telephone
Vs. written: more rapport, less nonresponse
Vs. face to face: less chance of demand/interviewer bias
Face to face
Highest rapport: response, data quality etc
On the downside: most effects of demand/interviewer bias etc
Potential problems with survey data:
Misunderstanding the question
Ps not having access to explicit cognitive representation of the item
Retrospective recall bias
Social desirability
Demand characteristics
Response sets
Survey Questions
Survey Instrument
e.g., the questionnaire; structured interview questions
Avoid double-barrelled, leading, loaded, unclear items
Pilot and pretest items
Always check if there exist measures used in previous (good quality) research
The interviewers
Experience matters
Training Procedures
Coding, meaning of codes. Need to pilot these too.
SPECIAL FEATURES OF THE SOCIAL SCIENCE RESEARCH CONTEXT
Our participants have minds and views of their own
They respond to their interpretation of what you ask not to your intentions
Our participants may try to guess why we ask what we ask
May colour their responses generally sequencing important
Question types
Open questions
usually cannot be answered by yes/no
speak or write an answer in prose-coded later
Closed questions
Common, response scale (1-7, T/F, Y/N etc)
Easy for most Ps; but if too easy = response set
e.g., the ATS breaks up into 2 scales that are formed by summing the items
These are summated scores
Just to be difficult, we get the same info by averaging
Problems in questions
Bias, no different from interviews and conversation
Leading (and loaded)
Should murderers roam the streets of our cities?
Should criminals do courses in jail at public expense?
Double-barrelled
Should unions launch strike action that disrupts the Melbourne Cup to protect workers’ rights?
Many (most?) popular media polls are like this
These are worse than useless
They don’t just fail to contribute to understanding, they can spread misinformation
Mistakes to avoid
Avoid leading questions
Avoid questions that are loaded with social desirability
Avoid double-barrelled questions
Avoid long questions
Avoid negations
Avoid irrelevant questions
Avoid poorly worded response options
Avoid big words
Avoid words and terms that may be represented
SPECIAL FEATURES OF THE SOCIAL SCIENCE RESEARCH CONTEXT
Our need to get orderly data (often quantitative responses to closed questions) is in constant tension with respondents’ desire to convey or to represent themselves accurately
Scribbling in the margins, made up scale points etc
Participants in the main do not understand that analysis of aggregated responses solves problems of individual responses being potentially ambiguous
Página 4
Week 3 Tute
- This is the one i missed
Syntax from Soph:
Bivariate regression:
Regression Line is relationship between left and right finger. Predict one variable based on other variable
y = intercept + slope x X
You can leave notes for yourself in SPSS syntax with * at start and end
Descriptives var= leftmiddle rightmiddle.
Frequencies variables = leftmiddle rightmiddle
/statistics=default
/histogram=normal
Graph scatterplot = leftmiddle with rightmiddle
Correlations variables = leftmiddle rightmiddle
Syntax instructions for bivariate regression
Regression Variables = leftmiddle rightmiddle
/Dependent (dependent variable) rightmiddle
/enter (predictor variable, X) = leftmiddle.
highlight to run
Find info to substitute into formula from results - coeffecients:constant and leftmiddle length. X is 0 as its at the intercept
y = intercept + slope x X
Y’ = b0 + b1X1
Residual: actual score - Predicted score
Página 5
Week 4
Types of Sampling Approaches
Página 6
Week 7 Tute
Multiple Regression
Y' = b0 + b1X1 +b2X2 + b3X3
Example:
Research question: what factors predict more positive attitudes towards video games
Predictors: age, plays video games?, time spent playing video games
Outcome variable: attitudes towards video games
regression var = videogameAttitdues age gamer timeVG
/statistics = defaults zpp
/dep = videoGameAttitudes
/enter.
r2 = proportion of variance in the outcome that can be accounted for by all predictor variables combined
example: r2 = .773 which means 77.3% is accounted for with variables and 22.7% is not from those, so must be from things we havent accounted for
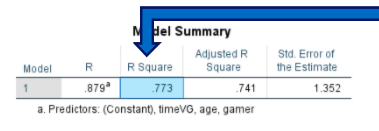
Predictive utility of regression model
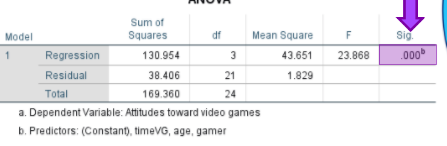
Do all predictors collectively account for a statistically significant proportion of the variance in the outcome variable?
sig = .000 therefore is significant
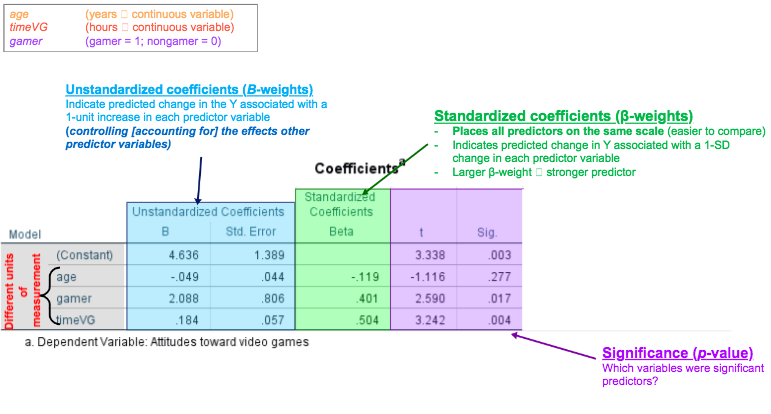
Standardized coefficients (β-weights)
Places all predictors on the same scale (easier to compare)
Indicates predicted change in Y associated with a 1-SD change in each predictor variable
Larger β-weight stronger predictor
Unstandardized coefficients (B-weights)
Indicate predicted change in the Y associated with a 1-unit increase in each predictor variable
(controlling [accounting for] the effects other predictor variables)
Significance (p-value)
Which variables were significant predictors?
Equation:
Y' = b0 + b1X1 +b2X2 + b3X3
example:
y = 4.636(-.049)age+2.088(gamer)+(.184)hours
Standadised makes easier to combine ie. age is years, gamer is y/n, hours is time
Age not sig (.277)
Game, timeVG is (.017 and .004)
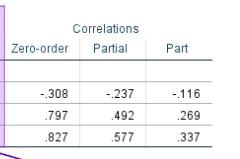
ZPP correlation FOCUS ON PART (in assignment)
Zero-order
bivariate Pearson’s correlation between predictor and outcome variable (r)
Partial
correlation between predictor and outcome variable (with the effects of all other predictors statistically removed [partialled out])
Semi-partial (part)
correlation between the predictor and outcome variable (with the effects of all other predictors removed [partialled out] only from the respective predictor)
We square the semi-partial values to calculate a the squared semi-partial (sr2)
sr2 = unique effect of each predictor
Percentage contribution of factor with everything else factored in
Partial correlation:
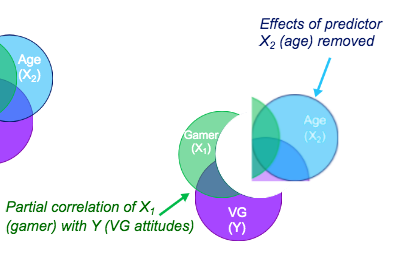
Semi-Partial correlation:
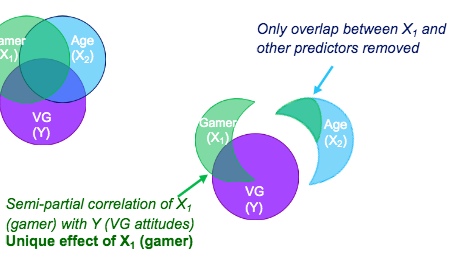
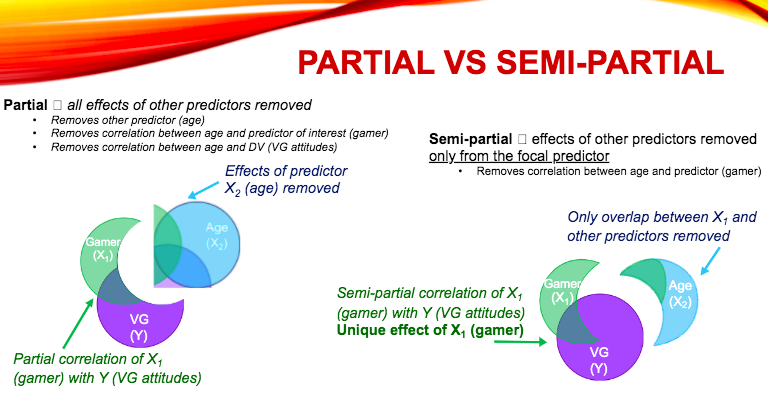
Semi-partial correlations
square semi-partial (sr2) statistic determines unique variance accounted for by each predictor
age (-.1162 = .0134) = 1.34%
gamer ( .2692 = .0723) = 7.23%
timeVG ( .3372 = .1135) = 11.35%
Pearson’s correlations between each predictor and DV
Negative correlation between age and video game attitudes (r = -.308)
Positive correlation between being a gamer and video game attitudes (r = .797)
Positive correlation between time spent playing video games and video game attitudes (r = .827)
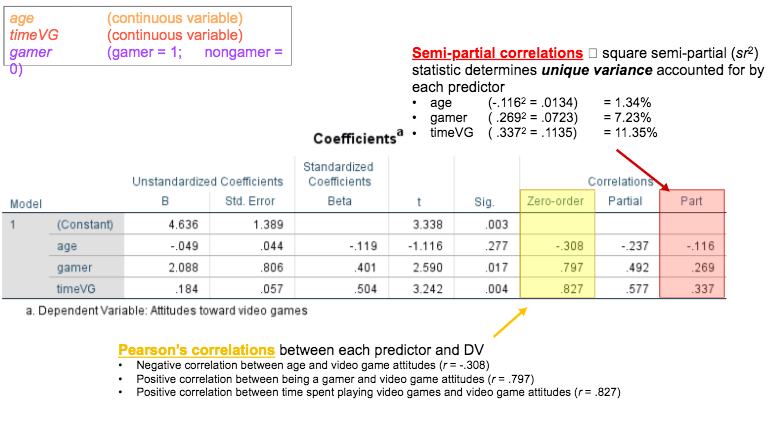
In diagram below:
Semi-partial correlations à square semi-partial (sr2) statistic determines unique variance accounted for by each predictor
•age (-.1162 = .0134) = 1.34%
•gamer ( .2692 = .0723) = 7.23%
timeVG ( .3372 = .1135) = 11.35%
- Individual unique part calculated
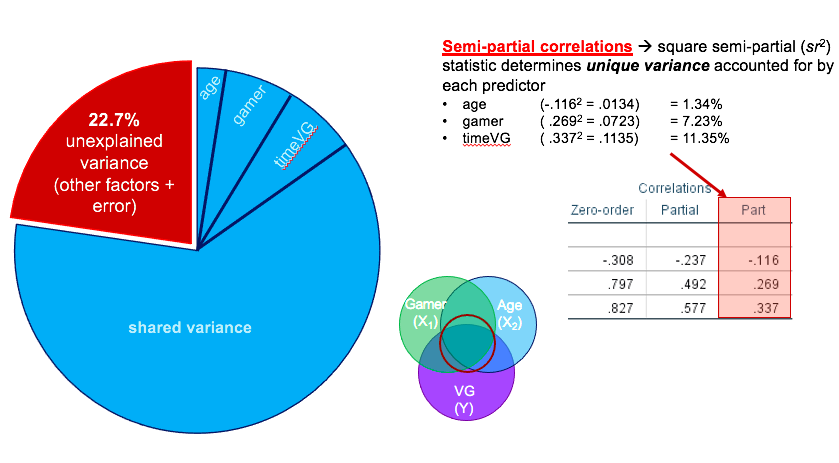
77.3% of the variance is explained by the predictors.
22.7% is error or other
Overall it is signfiant based on the significance level (.003)
y' = b0 + b1x1 + b2x2 + b3x3
y = 4.636 + (-.049)age + (2.088)gamer + (.184) timeVG
Correlations part
•age (-.1162 = .0134) = 1.34% = not sig (.277)
•gamer ( .2692 = .0723) = 7.23% = sig (.017)
•timeVG ( .3372 = .1135) = 11.35% = sig (.004)
We know that age, gamer and timeVG accounted for a significant proportion of the variance in attitudes to vg.
Example right up from worksheet:
a multiple regression was performed with gender, age, adn whether students completed maths B/C or not predicting attitudes towards this course. Table 1 displays the means, standard deveations and intercorrelations between teh four variables as was used in teh final regression. Gender was dummy coded where 1 was equal to being female adn MathsBC was dummy coded were 1 was equal to having done Maths B in high school. The regression model was found to be significantly different from zero, (F(3,65) = 4.06, p = .01. Altogether, our model accounted for 40% of the variability in attitudes towards this course. Examination of the B and Blong values and the sr2 values suggest that age was the strongest predictor of attitues towards this course accounting for 5% of unique variance in attitude towards this course. Respondents' age accounted for just under 5%of unique variance in the outcome, while gender accounted for 2%. Table 2 shows the unstandardised and standardised regression coefficients, squared semi-partial correlations and R2.
Página 7
Week 5
Basic recode:
recode variable_name (old_value = new_value) into new_variable_name.
Example: recode mathscourses (1,2 = 0) (3,4 = 1) (else=sysmis) into mathsBC.
Norms:
First, we normally assign the value of 1 in a dummy to the largest category. Second, we name the dummy for the group to which we have assigned the 1 score.
Important point: we always include into new_variable_name because we never want to modify the original data values.
Example, 2 statements, (1,2=0) (3,4=1), neatly cover the whole range of the mathscourses variable.
However, in practice, we can have variables with lots of categories (e.g. country of birth often finishes up with 50 separate values or more in a typical Australian sample if we include parents or grandparents). The beauty is that the syntax is exactly the same in form; we just include as many (old_value = new_value) statements as we need.
Example:
recode mathscourses (1,2 = 0) (3,4 = 1) (else = sysmis) into mathsBC.
Examples:
*(1 = 2) (2 = 1)
*simple one value swap (1 thru 3 = 1) (4 thru 6 = 2)
*ranges with minimum-maximum (1,3,5,7,8,12 = 1) (2,4,6,9,10,11 = 2)
*lots of non-contiguous values (1 = 5) (2 = 4) (3 = 3) (4 = 2) (5 = 1) (else = sysmis)
*reverse coding variable measured on a 1 -5 scale—same principle applies to all continuous scales (1 = 1) (2 = 0)
*creating a dummy from a variable scored 1-2. In regression, it matters that the values are 0 and 1. This is a very common manipulation (1 thru 3 = 1) (4 thru 6 = 0)
*creating a dummy from some sort of variable scored 1-6 (1 thru 3 = 1) (4 = 2) (5,6 = 3) (7 thru 9 = 4) (else = sysmis)
*we can mix and match all these as required we can put them on separate lines if it makes it easier to keep track of them and add white space too. e.g.,
(1 thru 3 = 1) (4 = 2) (5,6 = 3) (7 thru 9 = 4) (else = sysmis)
Página 8
Week 6
Correlations
Allow us to obtain an estimate of the population correlation
Reliability and validity estimates
Use in other analyses
E.g., basis of factor analysis
Calculate coefficient of determination
ie. variance occurance
Prediction
Cancer Risk
Predictors include:
Age, adiposity, alcohol consumption, medications, HRT, pregnancy, family history of breast cancer, ethnicity, etc
Criterion: Potential risk (range from low/average to high)
Is this 100% accurate? What is the “margin of error”
Regression and Prediction
If there is an association (or correlation) between Variables X and Y
if you know a value on Variable X (e.g., age), then you should be able to use it to make an educated guess about what the corresponding value on variable Y (e.g., cancer risk) will be
Regression gives life to the concept of correlation by using it for predictive purposes
In the language of regression,
Variable X in the previous example would be called the predictor,
and Variable Y the criterion
the predicted value of Y is referred to as Y’ (“y-prime”)
Sometimes referred to as (Y-hat)
if X and Y are perfectly correlated (r = 1 or -1), then prediction is easy…
just read off the scatterplot
but correlations are rarely ever perfect
However we can calculate a line that best represents the general relationship (or trend) of the data points
The “line of best fit” (aka the regression line) allows us to make predictions that are better than if we knew nothing about the relationship
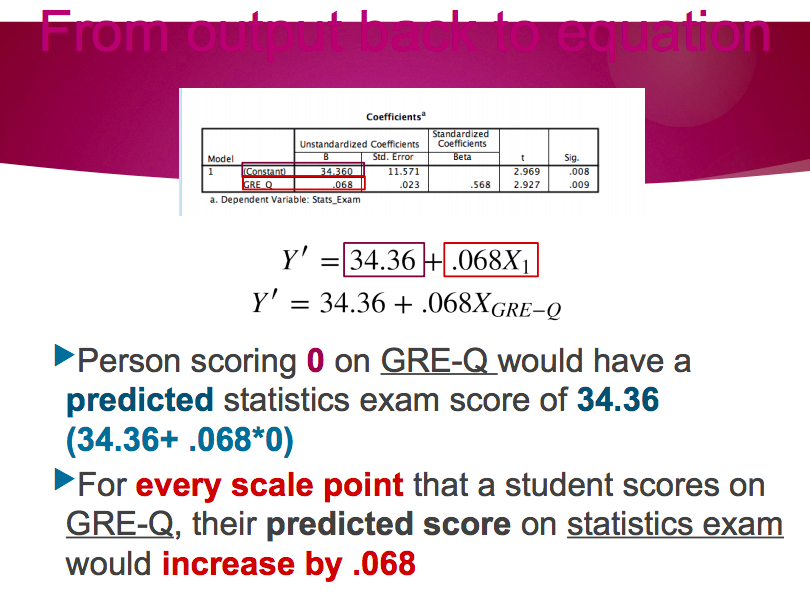
Y' = b0 + b1x1
·Y’ = predicted value of Y
b1 = slope of regression line · (rate at which Y changes with each 1-unit change in X)
b0 = intercept
(the predicted value of Y when X = 0)
Summary:
Correlations are used for multiple purposes
In this course we extend to the bivariate regression and use known associations to predict scores
We use the line of best fit (aka the regression line) to predict scores
Without knowing the association with other variables, our best guess on our criterion or outcome variable (our Y variable) is the mean of the Y
By using the regression equation that incorporates the value of the slope and intercept we can use the known associations with another variables to improve our predicted scores
Dichotomous Variables as Predictors
What if we had a record of all the students who attended every lecture during their graduate school statistics course and those that did not?
How would “attendance” correlate with statistics Exam performance?
What would the prediction be?
We can answer these questions using a special type of dichotomous variable – the dummy variable
Summary:
Regression analyses assume that both the outcome variable and the predictor variables are on a continuous scale
When we need to use dichotomous variables (i.e., categorical variables with two categories) we can create dummy variables by coding one category as one (1) and the other as zero (0)
We can then perform our regression analysis as usual
The value of intercept now has meaning and is the predicted value of the Y variable for participants who scored zero on the X variable
The value of the slope is the difference in the predicted score on Y for participants who scored one on X variable
You can calculate the predicted score on Y for these participants by simply adding (or subtracting if the slope is negative) to the intercept
Variance Explained
Bivariate regression
The special case of a single predictor and single criterion
An actual score comprises:
A systematic and
a random component
systematic = relationship w/ predictor
random = unrelated to predictor
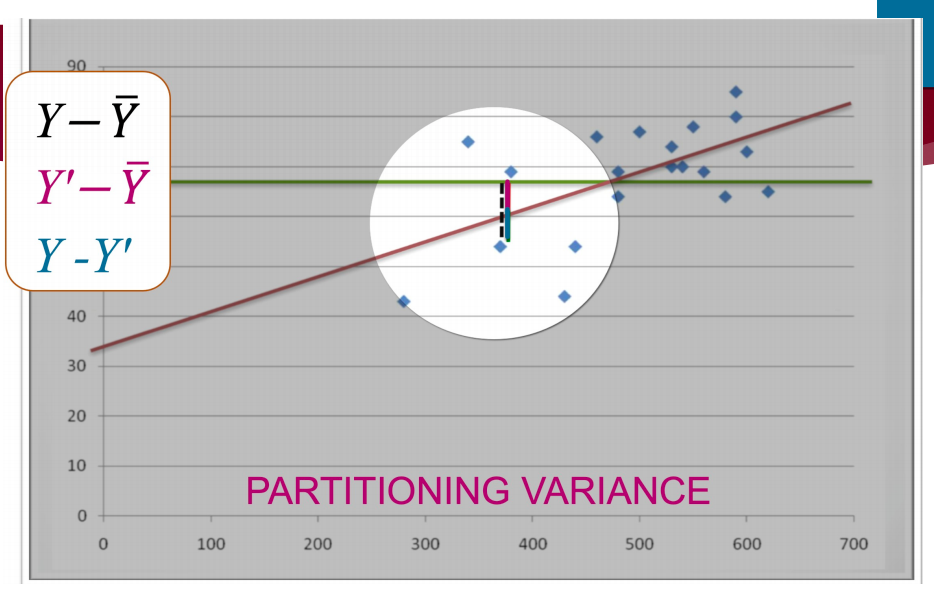
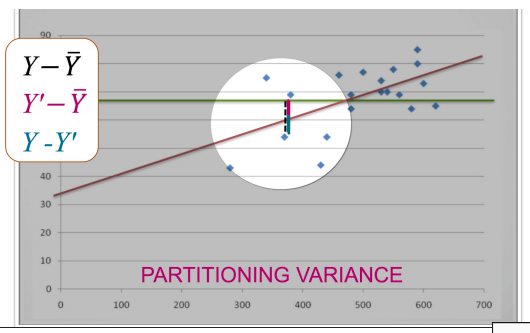
Total Variance
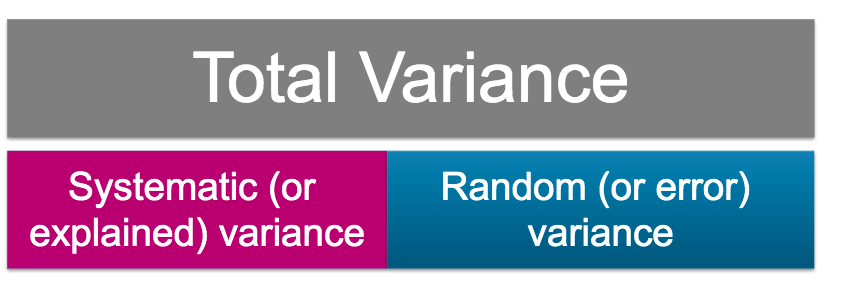
Total variance is the variance in the scores on the Y variable
We are interested in the deviations of all the scores from the mean of Y
This is represented by the black double-headed arrows
Systematic Variance
Systematic variance is the amount of the total variance accounted for (or explained) by the improvement in prediction by the regression line
This is the difference between each person's predicted score and the mean of Y
This is represented by the pink double-arrows
Random Variance
Random variance is the amount of variance leftover
This is the error or residual covered in the Prediction and Residuals mini-lecture in Week 4
This is simply the difference between people's actual scores and their predicted scores
This is represented by the blue double-headed arrows.
Sum of Squares
Sums of squares refers to the process that is part of calculating variance
Recall this equation from 1003PSY
In regression we care about explaining variance on the Y variable so we shall just change this a little
Recall to calculate variance you need to:
Calculate the deviation scores (score minus the mean)
Square the deviation scores
Sum them up
This part of the process creates a number called the Sums of Squares
Or more fully – the Sums of Squares of deviation scores
If I do the extra step of dividing by N I would have the variance. However, in regression we stop at the Sums of squares step
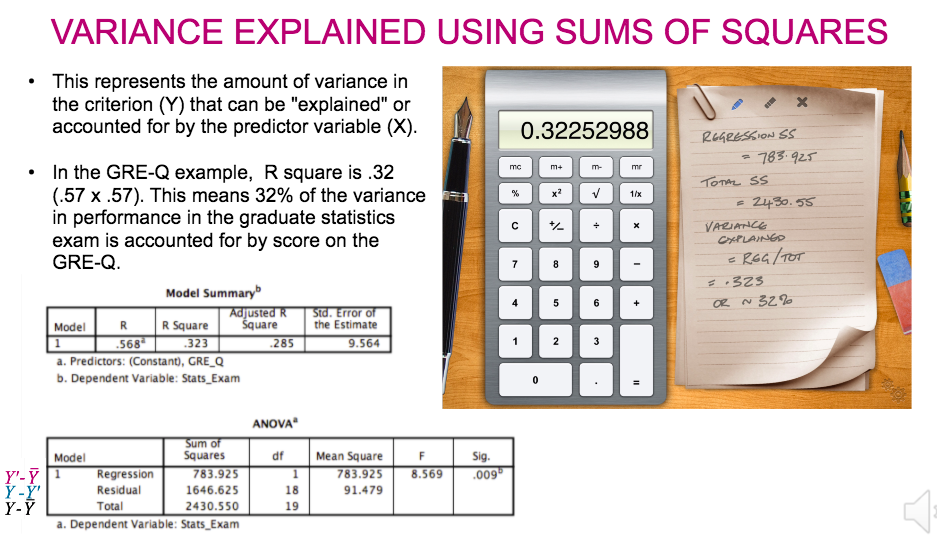
We can use the Sums of Squares approach to calculate the variance explained in our Y variable by our regression equation
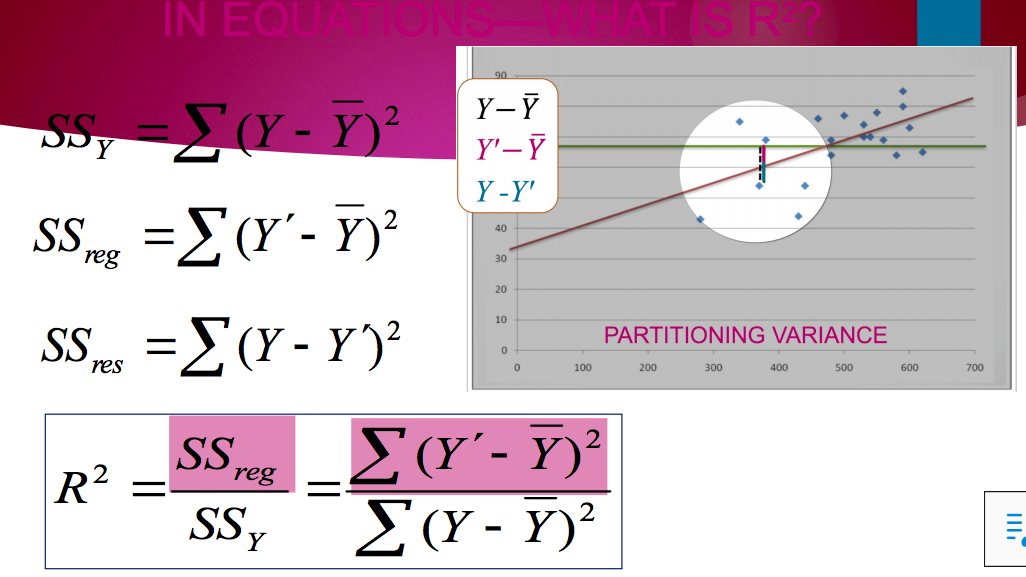
Total variance: SS for deviation scores from the mean of Y
- referred to as SSY or SSTOT
Systematic variance: SS for deviation of predicted scores from the mean of Y
- referred to as SSreg or SSregression
Random variance: SS for deviation of scores from predicted scores
- referred to as SSres OR SSresidual
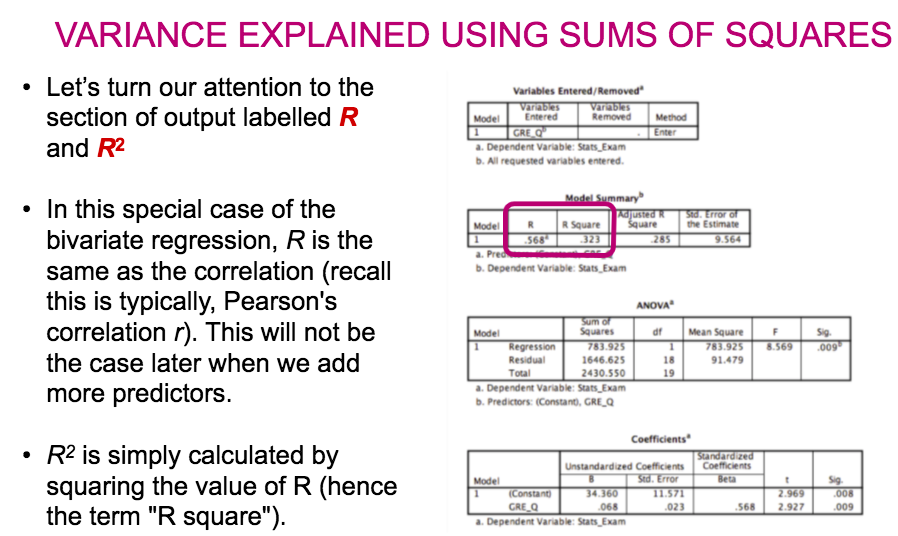
In correlation we can square the value of the correlation to obtain the variance explained
We could do the same in a bivariate regression as the Beta weight is the same as the correlation
However when we add in more predictor variables we cannot do this
Instead we will use two of our SS values and this formula.
R square is the proportion of the total variation of scores on the Y variable (SSy) that can be accounted for by the improvement in prediction by our regression equation (SSreg)
Página 9
Week 7
Multiple Regression
When we have > 1 predictor (X) variable, we simply need a way to combine them
The regression procedure expands seamlessly to do this…
Essentially, we extend the least squares procedure to estimate b0 and b1 and b2… bk to give us the best possible prediction of Y from all the variables jointly
This type of regression might be referred to in some texts as OLS, Ordinary Least Squares Regression
B-weights in multiple regression
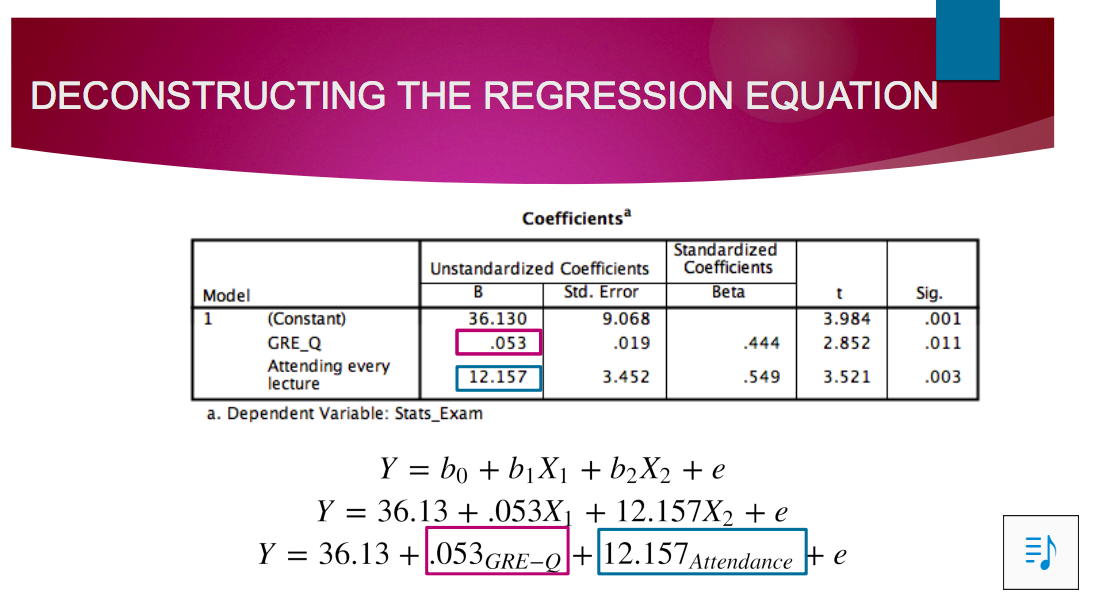
the b-weights are the numbers by which we multiply (i.e., weight) each X to make a composite X with all the information from the separate Xs in it • the b-weights are the numbers by which we multiply (i.e., weight) each X to make a composite X with all the information from the separate Xs in it
Are partial slopes:
each b tells us how much change in pred. Y there will be for a change of 1 in that X when all the other Xs are held constant
This gives us a clue as to how much each X is related to Y when considering the interrelationships among the Xs • better than looking at correlations among all variables as these are not corrected
Standardised Weights
Beta (β) weights
As for b weights but for standardised solution
Intercept = zero and drops out of equation
Give a measure of slope in standardised units
This aids in comparison but is not importance as is misleadingly stated in some sources
Variance explained
Significance testing
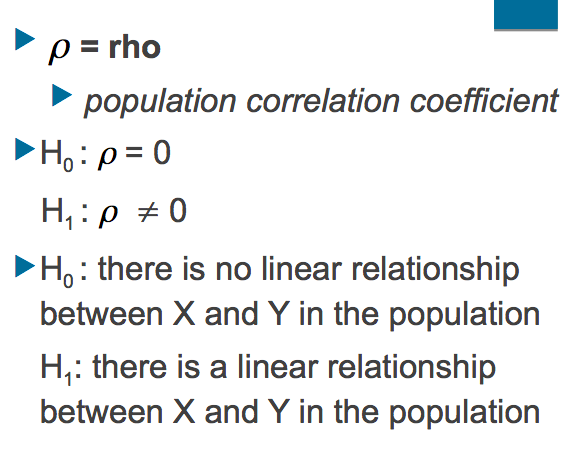
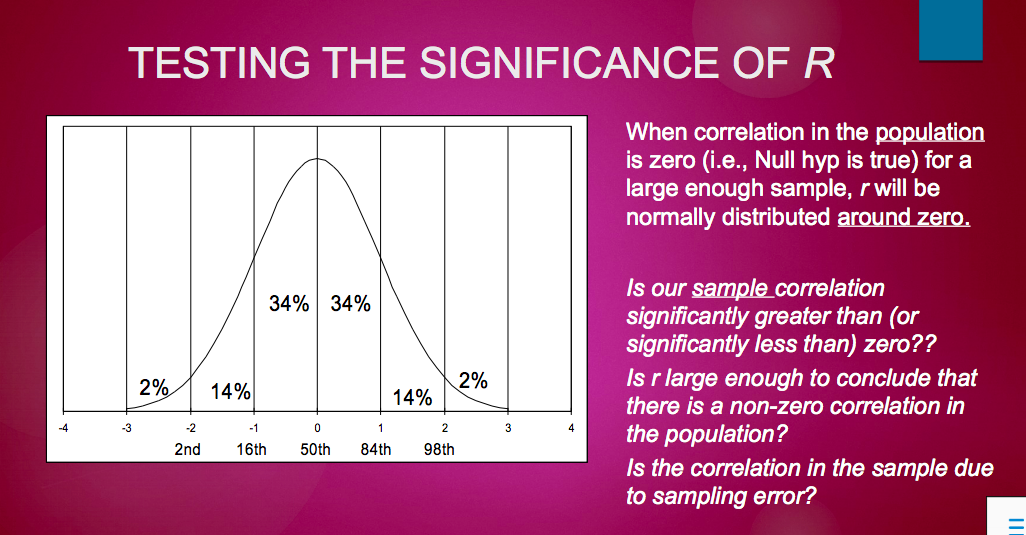
R significance
r describes the linear relationship between two variables in a sample
usually want to make inferences about the relationship in the population
is r large enough to conclude that there is a linear relationship between the variables in the population? or
is the correlation in the sample due to sampling error?
rho
Summary
Just as with our other analyses like the t test we check for significance of our overall R and for our b weights
The correlation in the population is referred to as (Rho)
We use the same concept of sampling distributions as we used with means to test whether the correlation or the b weight in our sample is significantly different from zero
In addition to testing whether there is a significant association between our predictors as a group (aka a linear combination; the regression equation) by looking at R we also test the significance of each predictor while controlling for all other predictors by looking at the significance of the b weights
Proportion of variance
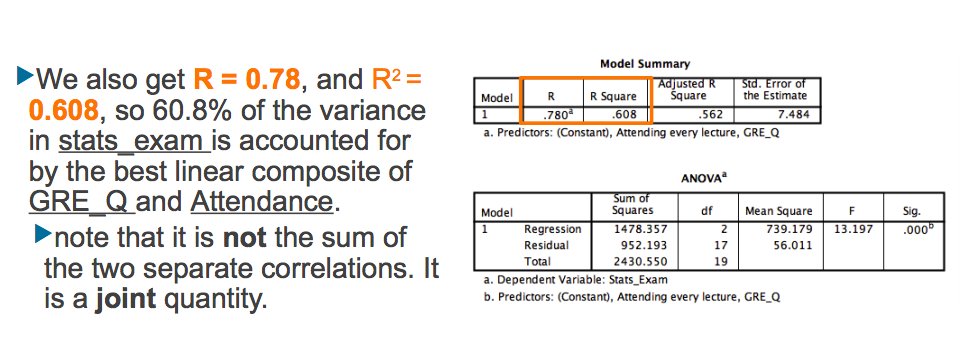
In correlation, r 2 = proportion of variance shared by X and Y, i.e., the two correlates—overlap
In regression, this still holds of course, but…
… now, we speak of the amount of variance in Y accounted for by X (either a single predictor or the set of predictors)
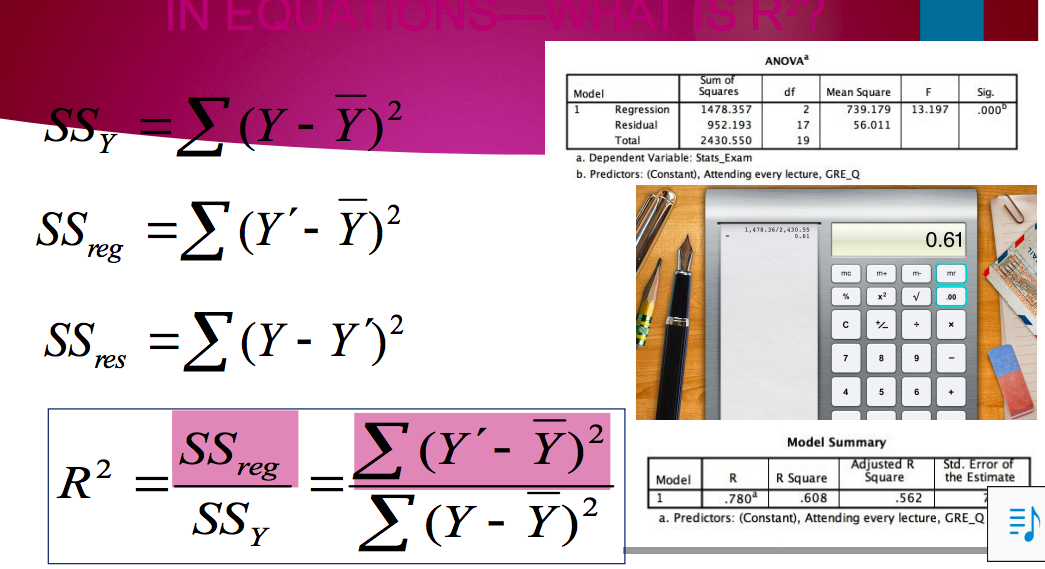
Multiple R2 is variance in Y accounted for by Xk
usually referred to simply as R2 Not specific to any one single X, it is for the set of them.
The regression equation is also referred to as the Model
we check the value of R2 in the Model Summary box in the SPSS output
Semipartial correlations—sr and sr2
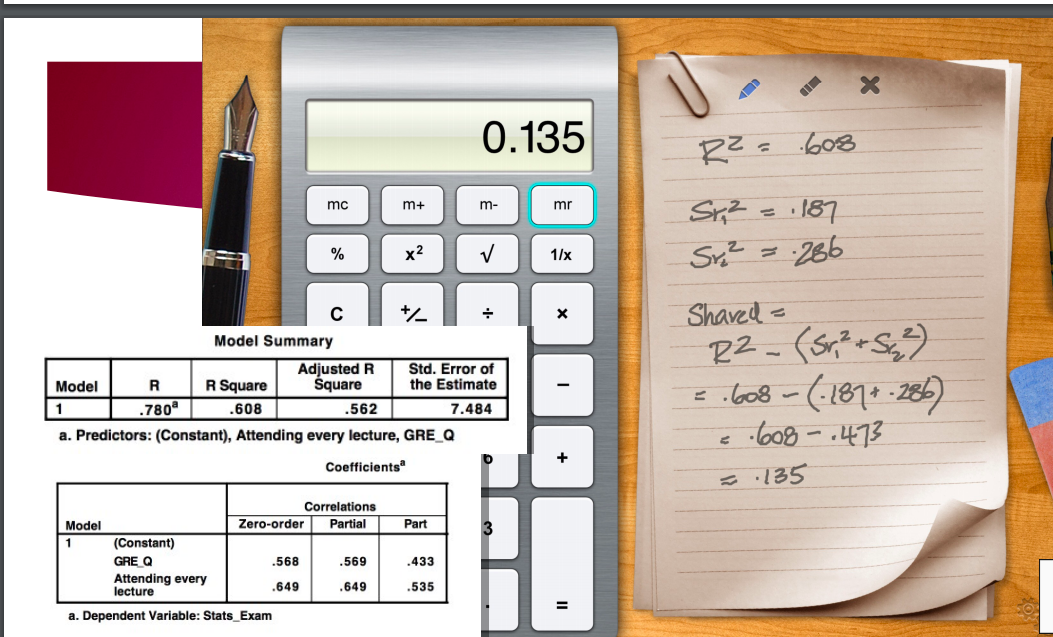
Relationship between Xk and Y when all other predictors partialled out of only Xk .
Good indicator of the unique relationship between Xk and Y
Always squared (i.e., sr2 ) to give proportion of unique variance in Y accounted for by Xk
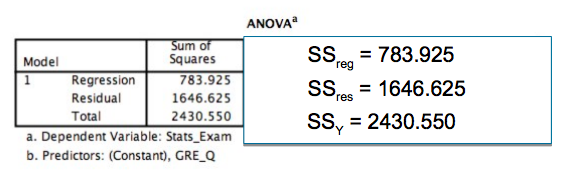
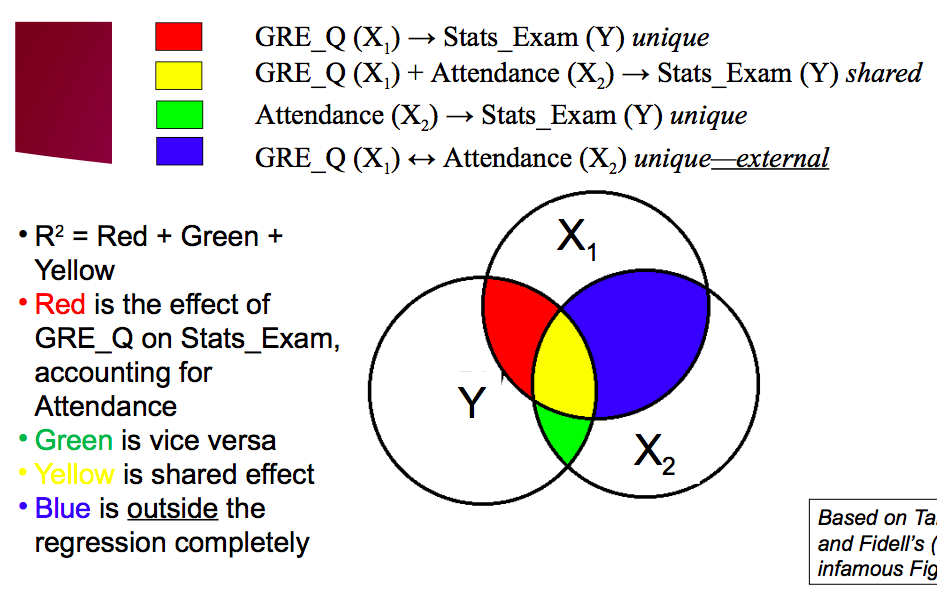
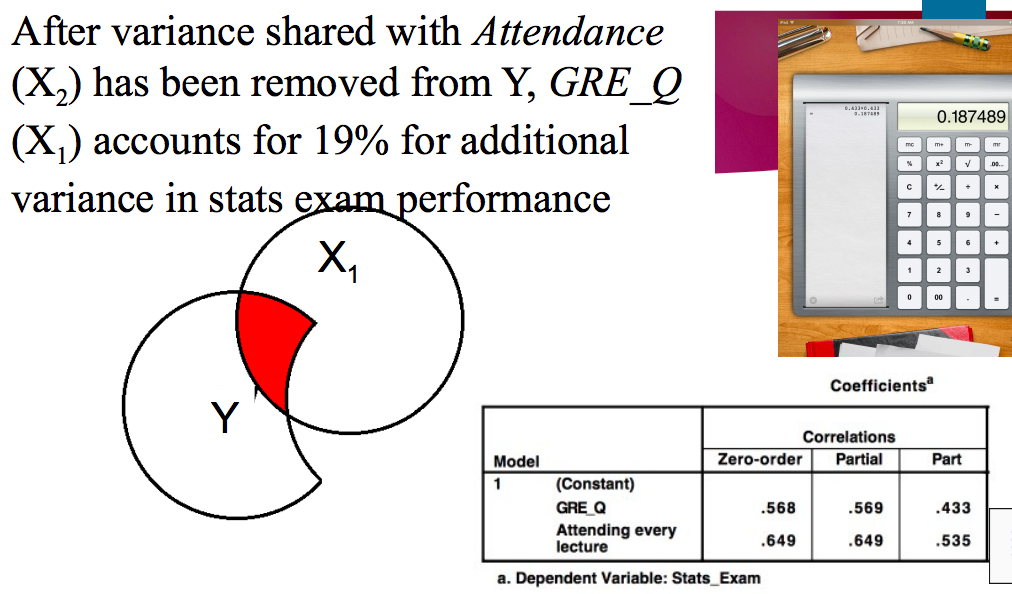
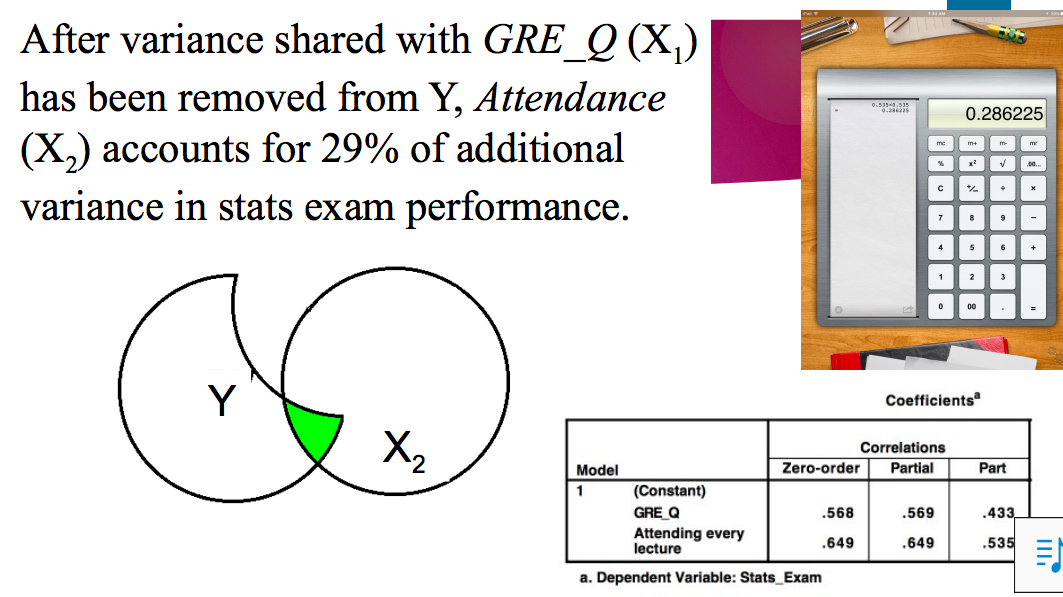
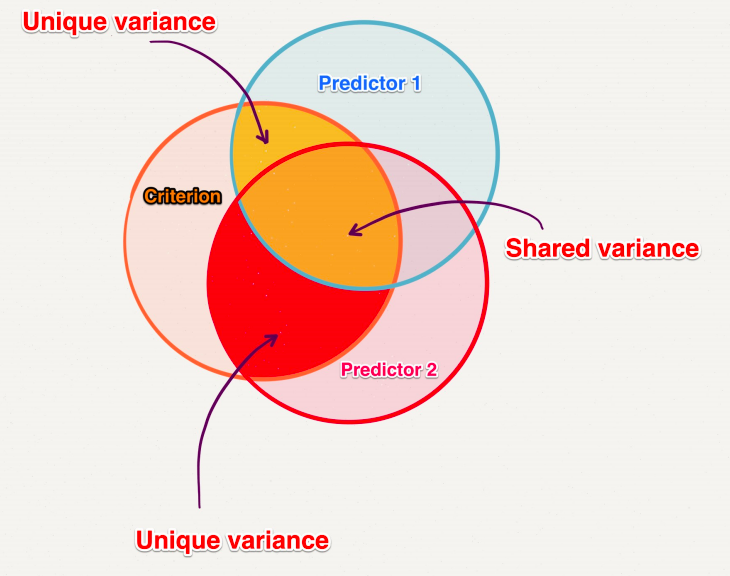
Shared Variance is the difference between the combined unique variance (sr2 GRE_Q +sr2 attendance) and total variance explained (R2 )
Summary
R square refers to the variance in the Y variable explained by the linear composite (aka regression equation or model)
In multiple regression we want the variance explained by each predictor variable after controlling for the other predictor variables
We call this unique variance and is represented by squared semipartial correlations
The difference between total variance explained (R2 ) and unique variance is shared variance
We can look at the unique variance to better understand the strengths of the relationships between our predictor variables and the outcome
Página 10
Week 8
Regression assumptions
Regression is a powerful analytic approach that requires consideration of underlying assumptions
Assumptions are made with regard to the residuals We assume normality of residuals, homoscedasticity, independence of residuals, and linearity
These assumptions are tested by requesting additional information in our syntax
Violations of assumptions may reflect skew, outliers, and/or non-linear associations
Violations
When assumptions have been violated, short of re-evaluating our model selection and our analysis plan, we turn to the state of the variables
Are the vars badly affected in terms of normal distribution?
It may be that addressing normality, where possible, may fix the violation
Q. If they are so, why are the variable/s nonnormal?
Skewness
Measurement? Structural property of data (e.g., frequencies)
Outliers
Curse of sampling (worse for small N)? Truly member of another population caught in our net?
Some advocate a strategy in which the analyst blindly checks all variables for skewness and kurtosis and routinely transforms any that are nonnormal
This is a problem if it is perceived to be a sort of insurance against later woes.
In fact, if the residuals and the residuals plots look OK (see Tutorials) then you don’t need any further transformations.
However, for the assignment still check skew, outliers, etc even if the residuals look ok.
You have to look at the data and have some idea of where they came from!! The data don’t know this themselves.
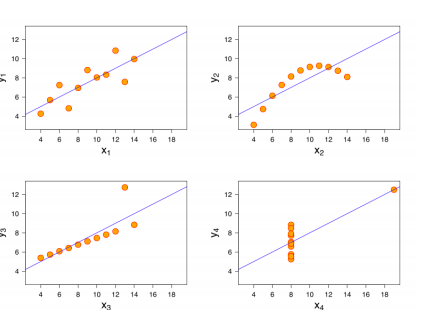
Anscombe's Quartet
Data sets famously derived by Frank Anscombe
These illustrate how characteristics such as nonlinearity and outliers can exert serious distortion on (our interpretations of) correlation (and regression) statistics
Most importantly, they point out that we cannot have confidence in statistics without examining the form (visually!) of the underlying data
They also show us that blindly chasing assumptions in regression could be as pointless without examining the data and trying to understand why it is distributed the way it is.
These illustrate how characteristics such as nonlinearity and outliers can exert serious distortion on (our interpretations of) correlation (and regression) statistics. Most importantly, they point out that we cannot have confidence in statistics without examining the form visually of the underlying data.They also show us that blindly chasing assumptions in regression could be as pointless without examining the data and trying to understand why it is distributed the way it is.
The four dataset are created to all have the same mean, variance, correlation, and regression equation
Dataset 1
The scatterplot from Dataset presents a very nice linear pattern of scores that evenly lie near the regression line. However, the scatterplots from the other three datasets look very different even though the descriptive statistics would be identical.
Dataset 2
Below I have superimposed the scatterplot based on the second data set. Drag the line to show the differences between the scatterplots based on the two datasets. Recall that this dataset has the identical (to 1 decimal place) means, variances, correlation, and regression equation. See how by looking at the scatterplot that we have a curvilinear association !
Dataset 3
Below I again have superimposed the scatterplot based on the third dataset over the original data. Once again I remind you that this third dataset has the identical (to 1 decimal place) means, variances, correlation, and regression equation ! See how by looking at the scatterplot that we can see that we have an outlier on the Y variable
Dataset 4
Finally , I have superimposed the scatterplot based on the fourth dataset over the original data. Reminding you yet again that this third dataset has the identical (to 1 decimal place) means, variances, correlation, and regression equation ! See how by looking at the scatterplot that we can see that we have an outlier on the X variable.
More regression assumptions
Regression assumptions are actually made about the residuals (i.e., the e in Y = b0 + b1x1 + e)
We can’t do anything directly to the error as it is what is left over after the line (i.e., predicted Y) has been fit
regression will still “work” for nonlinear relationships but interpretations of parameters on face value may be meaningless
Normality
residuals (errors) are normally distributed with mean = 0
often said, centred around 0 (zero)
Homoscedasticity
constant variance of residuals (across predicted scores)
Independence of errors
The residuals are uncorrelated with Y
linearity of the relationship
If we want the benefits of regression to answer our RQ, we have to pay the costs of ensuring that our data meet the underlying assumptions
MR Partitions
We predict the actual ( Y) score from the Xk predictors—what Y “should” be
A predicted score (Y′) is derived from this
Unless the correlation is perfect, Y ≠ Y′
Y - Y′ = e
e = error/residual
= whatever leftover in Y that Y′ doesn’t account for
Y = Y′ + e
Y = Predicted + Residual
Each person “has”:
an actual (Y) score
a predicted Y′ score
a residual “score”
Residuals
If the regression equation has underestimated the actual score, the residual will be positive
If instead the true score was overestimated, the residual will be negative
The assumptions are about the residuals but we use the standardised scores and regress the standardised residuals on the standardised predicted score. • We don't need to do this separately we use syntax and add this to the multiple regression syntax
The residuals can take on distinctive patterns if there is something systematic and amiss.
If there were only true score and random error in our data and we hadn’t omitted any important predictors of our outcome, we would expect nice neat, normally distributed residuals centred around zero…
Anything else means that there might be a problem
Homoscedascity
When we have our residuals correlated with predicted scores
And we have random error (i.e., error is independent of association with the criterion)
And we haven't left out important predictors
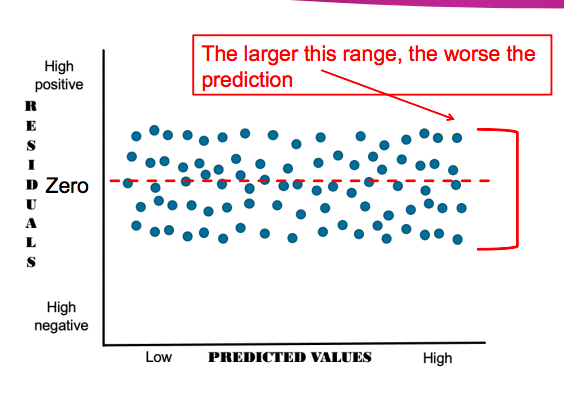
We should have a rectangular shape
We have met the assumption of homoscedascity
The residuals should be evenly scattered above and below zero
The range of residuals around zero should be narrow
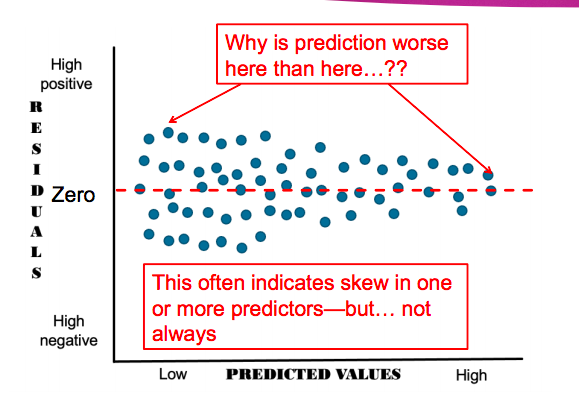
If however our residuals look like a funnel or a fan then this suggests that we have not met the assumption of homoscedascity
The distribution of residuals across the range of predicted values of Y is not even
If however our residuals look like a funnel or a fan then this suggests that we have not met the assumption of homoscedascity
The distribution of residuals across the range of predicted values of Y is not even
How do we address violations
Short of using a different statistical procedure entirely, we have 2 courses of action open to us
We may find one or more outlying data points on one or more variables that are unduly influencing the regression analysis and leading to potentially erroneous conclusions
One or more predictors may deviate greatly from normality—skewness and kurtosis. Again, this may lead to errors
a) In this case, we generally apply one or more transformations of the data (in turn, not concurrently).
b) We replace the actual variable with the transformed one in the regression.
c) Certain transformations may help alleviate skewness (caution, hit and miss!)
Outliers and transformations are covered in the next topic and in the tutorials
Regression is a powerful analytic approach that requires consideration of underlying assumptions
Assumptions are made with regard to the residuals
We assume normality of residuals, homoscedascity, independence of residuals, and linearity
These assumptions are tested by requesting additional information in our syntax
Violations of assumptions may reflect skew, outliers, and/or non-linear associations
Página 11
Week 9
Non-parametric tests: Spearman's Rho
All of the tests we have considered up to this point have involved:
estimating population parameters
assumptions about the shape of the data
assumptions about the scaling of the variables
Estimating Population Parameters
parametric tests involve the estimation of at least one population parameter
e.g., t-test uses sample variance to estimate the population variance
non-parametric tests do not— hence the name
Assumptions about the shape of the data
Parametric tests also make assumptions about the distribution of the population from which the data were randomly sampled all the tests we’ve looked at so far have all assumed that the data is normally distributed
e.g., t-test assumes that the sampling error is distributed normally around m
non-parametric tests do not make a priori assumptions about the specific shape of the distribution—hence they’re also known as distribution-free tests
Assumptions about the scaling of the test
Parametric tests assume the outcome variable has been measured at interval or ratio level
Non-parametric tests do not
Non parametric tests
Advantages
They do not require assumptions of normality and homogeneity of variances (severely skewed data can be analysed with nonparametric statistics)
Ideal for analysing data from small samples (small samples are often skewed and can’t be rescued by the central limit theorem)
Generally easier to calculate--require less computation
Use of ranks reduces effect of extreme outliers
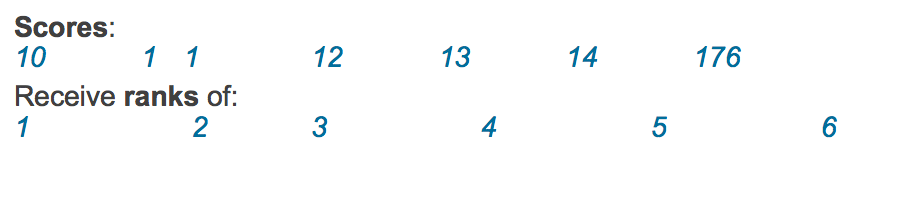
Explaining Ranking
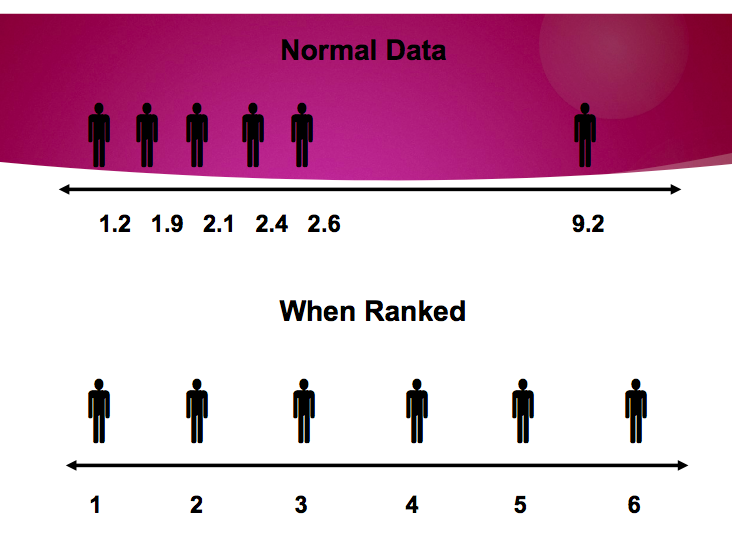
ranking merely involves the ordering of a set of scores from the smallest to the largest
the smallest is given the rank of 1, the second smallest the rank of 2 … the 50th the rank of 50
Why rank?
it provides a standard distribution of scores with standard characteristics
Spearman Rank-Order Correlation Coefficient (or Spearman's Rho)
Pearson’s correlation coefficient r is based on assumptions:
interval or ratio data,
X and Y are normally distributed, and
a linear relationship between X and Y
So we assume a bivariate normal distribution based on interval or ratio scales
Spearman's rho (rS ) is calculated using Pearson’s r formula - the difference is that the data is ranked
this is handy if:
The data naturally falls in ranks
there are extreme scores in your sample
there is a monotonic relationship between the variables
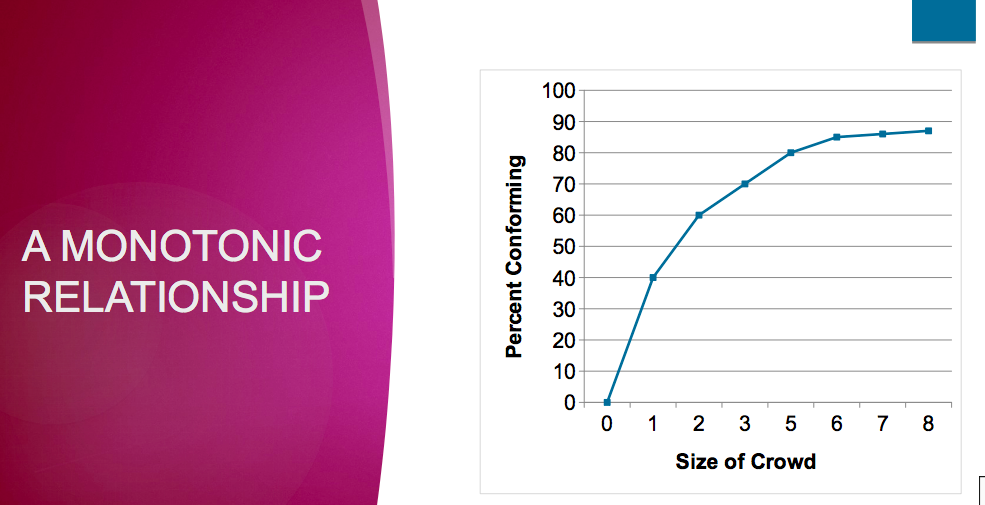
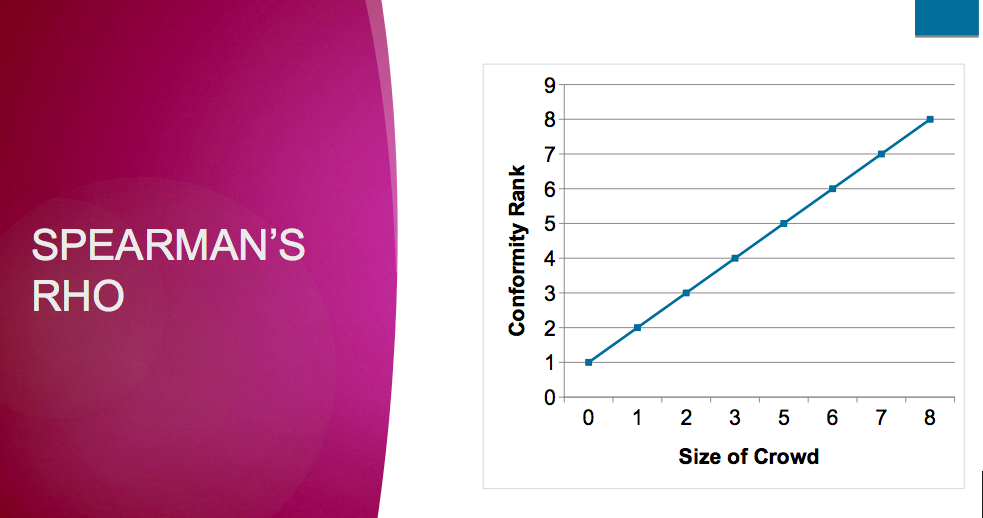
another benefit of Spearman’s rho is that it can be used when you have two continuous variables, but one (or both) is badly skewed due to extreme scores
The Null Hypothesis
The goal of any non-parametric test is to establish overall differences between two (or possibly more) distributions, not to identify the differences between any particular parameters
as a result, H0 is more general
samples come from identical populations, not just populations with the same mean
rejecting H0 means that populations differ (perhaps not just on the basis of their central tendency - i.e., the mean)
Summary
Parametric tests involve estimating population parameters, making assumptions about the shape of the data and assumptions about the scaling of the variables
Non-parametric tests do not
Ranking is one approach used by non-parametric tests
Spearman's rho can be used to calculate correlations between variables that has natural ranks, there are extreme scores in your sample or there is a monotonic relationship between the variables
While fewer assumptions are required to be met non-parametric tests are generally less powerful than parametric tests.
Point serial Correlation
Pearson’s r is appropriate for describing linear relationships between two continuous variables
if one variable is genuinely dichotomous, score one level of that variable as 0 and the other as 1 (or 1 and 2, or any two numbers)
compute correlation using Pearson’s r formula
referred to as the point-biserial correlation (rpb)
Interpretation of point serial correlation
absolute value of rpb reflects strength of the relationship
but the sign of the correlation depend on scoring (0 or 1; or 1 and 2)
r 2 pb interpreted the same way as r 2
test for significance in same way as for Pearson’s r
rpb and t
Alternatively, we could examine the relationship between a dichotomous and a continuous variable using an independent groups t-test
Result of test of significance of r pb and t-test will be identical
Summary
A point biserial is a special case of a correlation with one continuous variable and one dichotomous variable
The point biserial is interpreted the same a Pearson's correlation
The t value and significance of a dichotomous predictor in the regression output is the same as if the analysis is tested as a t test.
You can use the regression equation to calculate the mean of the two groups in the dichotomous variable just like in a t test
Página 12
Week 10
Chi Square
Chi square is a test used on frequency data
Chi square allows us to test research questions with categorial data
Categorical
Nominal
measures are just names for things e.g. gender
Continuous
Ordinal
measures the rank ordering of something e.g. 1st/2nd place
Interval
equal differences between scores can be treated as equal units e.g. degrees C
Ratio
interval scale with a true zero point e.g. length
Chi Square
In the one-way chi square we can ask research questions like
Are people/things distributed evenly across the categories of the variable? We can also test out other distributions (we will come back to this)
Chi Square Test:
Chi-square analyses involve working out the expected likelihood of something happening (what frequencies you should get if the null hypothesis is true) and comparing it with the observed frequencies (what frequencies you do get)
Chi-square tells you how well the expected and observed frequencies match … for this reason it is often referred to as a test for “goodness of fit” (do the observed frequencies “fit” the expected frequencies?)
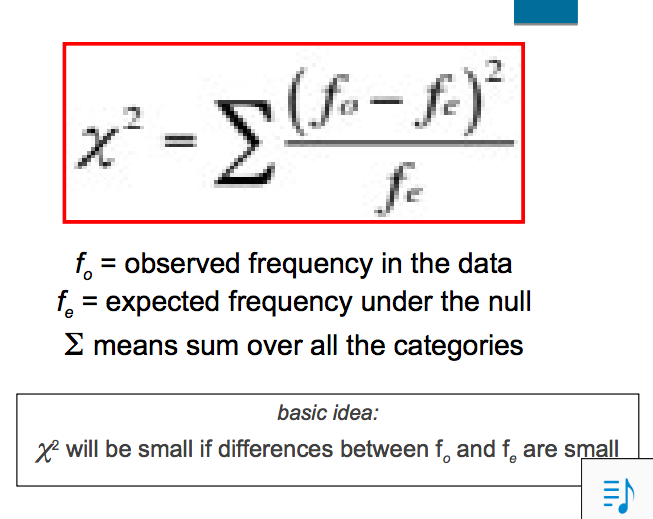
Calculation of chi (x2)
f o = observed frequency in the data
f e = expected frequency under the null
means sum over all the categories
x2 will be small if differences between fo and fe are small
Expected Frequencies
what do we expect? what is the null?
uniformly distributed -> equiprobable distribution
distributed in accord with theory
distributed in accord with previous observed frequencies
normally distributed
COMPARING OUR OBTAINED STATISTIC AGAINST CHISQUARE DISTRIBUTION (NULL)
H0 : in the population, the distribution across categories = expected frequencies
Therefore, any discrepancy = chance
How big can the discrepancy be before we reject possibility of H0 being true?
Use the standard cutoff of .05
i.e., a discrepancy large enough that less than 5% of samples exhibit it when the null hypothesis is true.
SAMPLING DISTRIBUTION OF X2
x2 is a family of distributions dependent on df
however, df depends on number of cells, not number of participants
• df = k – 1
X2 values always positive
can increase x 2 obt by increasing sample size
e.g., could double x2 value by doubling sample size but x2 crit remains the same
In practice
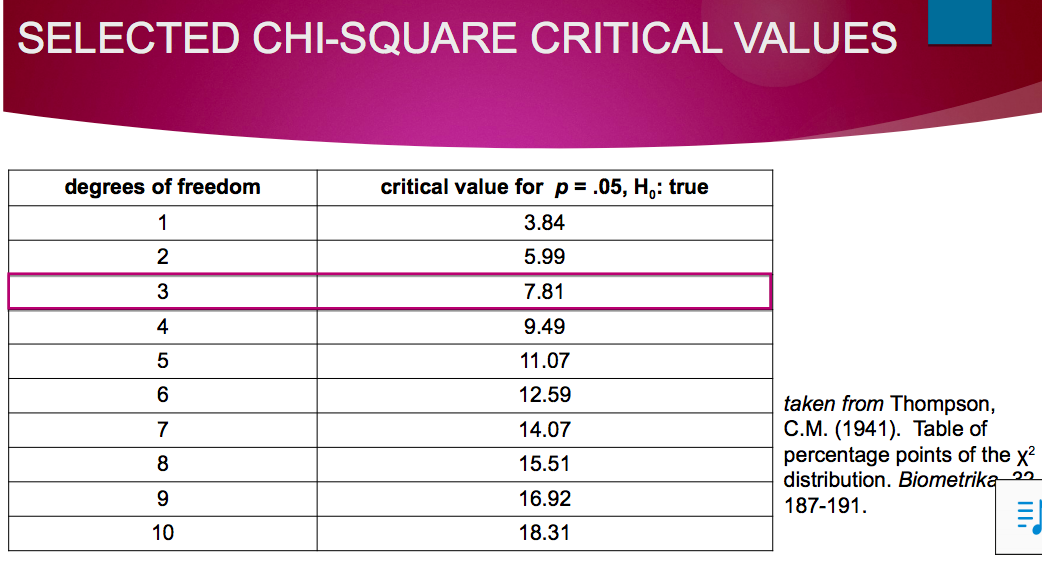
We only need the critical value of chi square for the degrees of freedom in our study
• critical value = value that marks .05 region under the null
Calculating df for a one-way chi square
df = k – 1, k = number of categories
Four categories of chupa chup flavour
k = 4, so the df = 3
Expected frequencies
for some variables, simple equivalency distributions under chance might be a useful benchmark against which to test
e.g., marketing and popularity of choice
in other cases, we might have a more plausible expected distribution against which to test our sample
that is, we already know that the categories won't be exactly equal
what do we expect? what is the null?
uniformly distributed -> equiprobable distribution
distributed in accord with theory
distributed in accord with previous observed frequencies
normally distributed
Summary
Chi square tests research questions for nominal (aka categorical) data
Chi square tests use frequency data
The one-way chi square test is also referred to as the Goodness of Fit chi-square
The chi square compares obtained frequencies to expected frequencies as stated under the null hypothesis
To test the significance of a chi square, the obtained value is compared to the critical values in the chi square distribution
The degrees of freedom in chi square depend on the number of categories – not the sample size
The one-way chi square can specify different null hypothesis
A common null hypothesis is the equiprobable distribution
TWO-WAY CHI SQUARE AKA CHI SQUARE TEST OF INDEPENDENCE
Relations between variables can also be tested with the chi-square test
Good news: formula for chi-square the same
Less than good news: new formula for fe
you’ll love it in the end
The null hypothesis in this case is that the two variables are distributed independently
referred to as x2 test of independence
Also x2 contingency
One variable must not depend on another
two variables are considered to be independent when the frequency distribution for one variable has the same shape for all levels of the second variable
i.e., salary is independent of gender
Summary
One-way chi-square (aka goodness-of-fit)
One-way: generally, does the observed data fit the model?
Two-way chi-square (aka test of independence)
Two-way: are the two variables independent ?
test two somewhat different questions
THE LOGIC OF THE TEST OF INDEPENDENCE
By ignoring the frequencies within the body of the table and just focusing on the marginals, we are viewing the data from the perspective of the null (H0 )
if H0 is true, then the marginals are all we need to understand the variables as they would be distributed independently
How do we obtain the necessary expected frequencies?
we use the frequencies expected under independence
If the variables are independent, the relative proportions of those who passed/failed (70:30) should be mirrored in each level of the Attendance variable
i.e., 70% of those with perfect attendance would pass and 30% would fail and
70% of those with less than perfect attendance would pass and 30% would fail
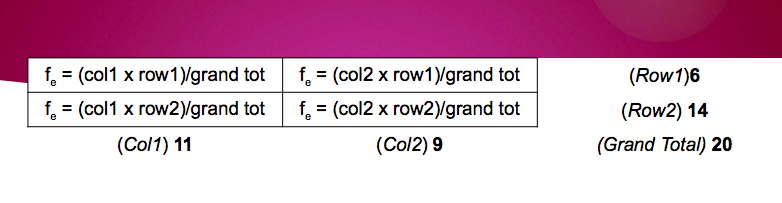
We only need the marginal totals and the grand total
the expected frequencies (i.e., fe ) represent the null
For each cell: f e = (column total x row total)/grand total
We have essentially duplicated the table and replaced the obtained frequencies (i.e., our actual data) with the expected frequencies that represent the way the data ought to look under the null (i.e., when H0 is true)
Two-way chisquare
for a two-way chisquare, df = (Rows – 1)(Columns – 1)
in our case: df = (2 – 1)(2 – 1) = 1
Critical value for df = 1 is 3.84 p = .05, H0 : true
Our obtained value of chi square of 7.02 is larger than 3.84.
Therefore we reject the null hypothesis of independence and conclude that our sample represents a population in which class attendance and grade (fail/pass) are associated i.e., not independent
Summary
The two-way chi square tests the association between two categorical variables
The two-way chi square is also referred to as the Test of Independence
The expected frequencies of the two-way is set to test for independence of the two variables
The calculation of expected frequencies involves the marginal totals and the grand total
The obtained chi square is tested against the chi square distribution
The calculation of degrees of freedom involve the number of categories of both variables, not sample size
Calculating by hand is better than SPSS when you only have the cell means
ASSUMPTIONS OF x2
independence of observations
a participant must fall in one and only one category – they cannot be counted twice thus you cannot use chi-square on repeated measures designs
special forms of tests exist to test out such relationships but these are well outside the scope of 3003PSY
size of expected frequencies
all expected cell frequencies should be at least 5, if they aren’t you shouldn’t use a x2 test
small expected frequencies produce few possible values of chi-square obtained x2 but we compare to continuous distribution
the greater the degrees of freedom, the more lenient this requirement
Inclusion of non-occurrences
computations must be based on all participants in the sample
Limitations
Not really a limitation but this is restricted to ≤ 2 vars
larger designs routinely analysed using multivariate generalisations of these approaches that are largely based on log-linear models and are best covered in their own course!
just as MR is to simple regression, log-linear models are to chi square
Effect size
a significant x2 does not indicate strength of the relationship 2 does not indicate strength
if your sample size is large enough, sometimes very small effects will be detected as significant
a significant x2 a significant c does not indicate strength of the relationship
if your sample size is large enough, sometimes very small effects will be detected as significant if your sample size is large enough,
but we can convert x2 to a measure of association that tells you how big the effect is
EFFECT SIZE: PHI
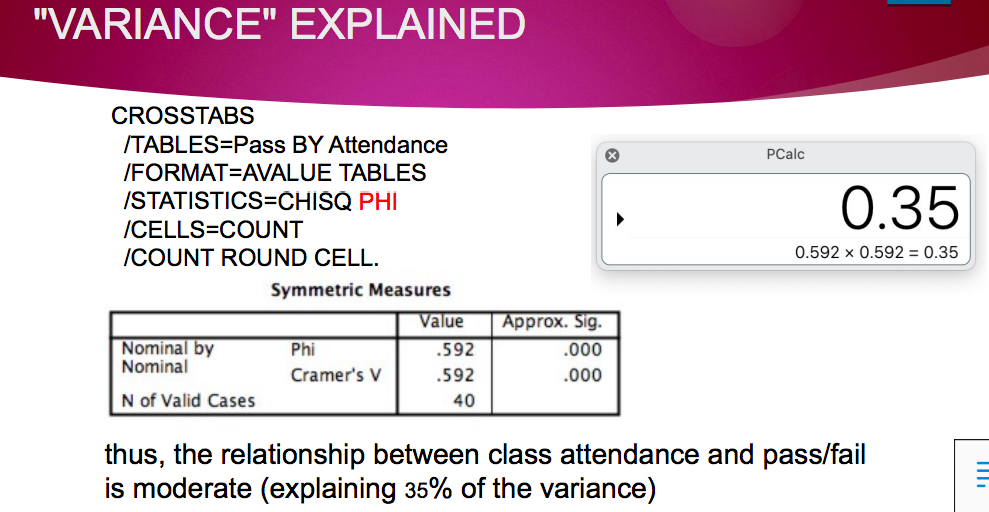
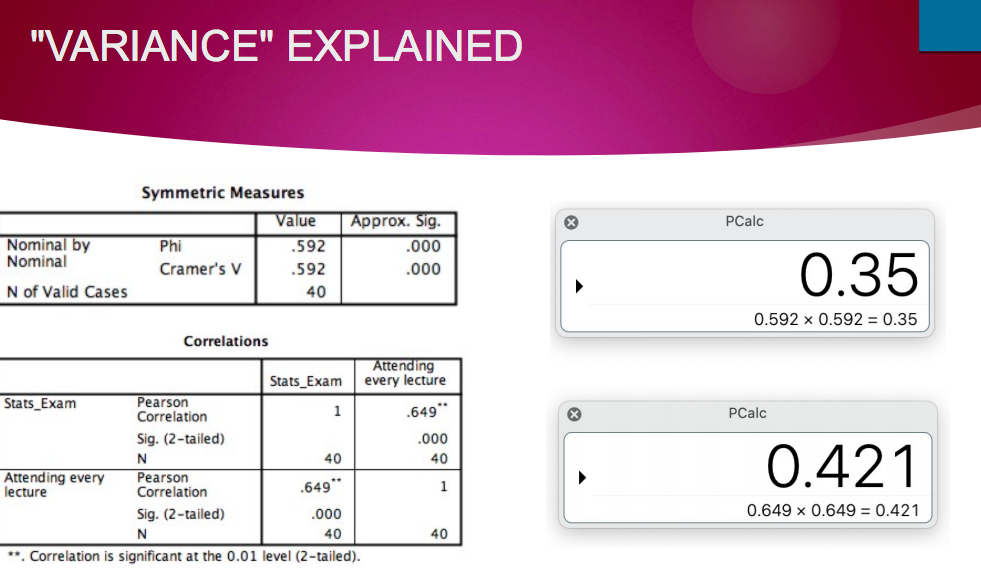
phi (f) for 2 x 2 chi sqaure
interpreted as Pearson r
correlation between two variables, each of which is a dichotomy
if chi-square is significant, so is phi
can be interpreted in terms of Cohen’s conventions.
Although is a measure of association between two variables, rather than effect size, these concepts are related.
so, for example, if = .50 – you could say that there is a moderate level of association between the two variables.
or, for example, if = .65 – you could say that there is a moderate to high level of association between the two variables.
Cramer’s phi (fc ) a generalisation of phi to r x c tables (will also work for a 2 x 2 table, as k – 1 will = 1)
Interpret the same as Phi
Summary
Chi square has several assumptions and limitations
Independence of observations
Expected cell frequencies of at least 5
Inclusion of non-occurrences Can only be used with 1 or 2 variables
As DFs are based on number of cells, sample sizes has a strong influence on the obtained chi square and by extension significance
Phi is the measure of association between categorical variables in a 2 x 2 chi square
Squaring Phi provides variance accounted Cramer's Phi is used for chi squares with > 2 x 2
Página 13
Week 11
Surveys and Causation
•Determinations of causation are based on three criteria
1.The constructs need to covary;
1.There must be temporal precedence, and;
1.No confounding factors (i.e. alternative explanations need to be ruled out).
Temporal Precedence
•In cross-sectional research, temporal precedence can never be directly empirically tested
•The ‘causal’ direction is inferred by allocating a variable as the criterion (DV), and others as predictors (IVs). This suggests the IVs ‘cause’ the DV.
•Theory and previous empirical findings are used to justify the direction of the statistical analysis.
Panel Design
•Panel designs are the gold-standard technique in longitudinal survey research.
•In a panel design, the same participants complete the same questionnaire over multiple time points.
•This ensures that both the predictor and criterion variable are measured at multiple time points.
Stability and Change
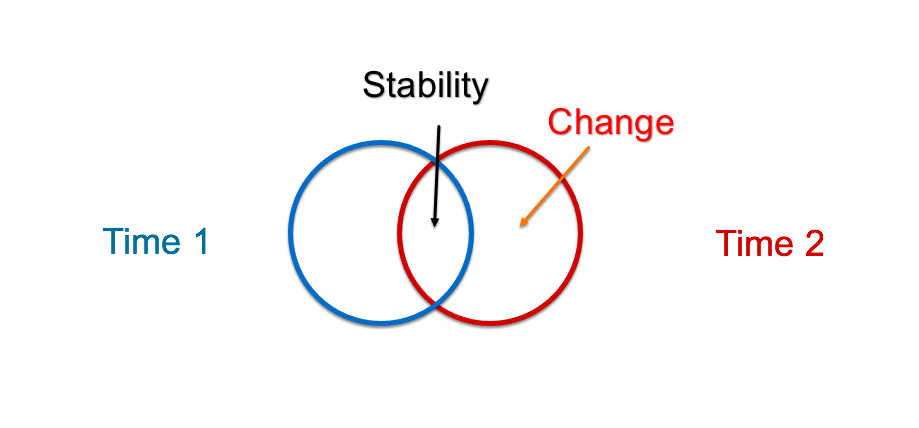
Stability: The degree of consistency in scores, means, or rank orders from one time point to another.
•A large autoregressive coefficient can mean one of two things*:•
1.Individuals do not change over time.
2.Individuals uniformly increase or decrease over time.
*There are other, more complex and less common explanations, that are not covered in this course.
Change: The degree of fluctuation in scores, means, or rank orders from one time point to another.
•In what ways and how much do things stay the same over time versus how much do they change. Often tested as baseline (the initial measurement) to re-test.
DIRECTION OF THE ASSOCIATION
•Uni-directional relationship:
•There is a clear direction in the relationship between the predictor and criterion variable.
•A uni-directional relationship in a well-designed longitudinal study provides support for temporal precedence
Bi-directional relationship
•Occurs when the predictor variable is related to the criterion variable, and the criterion variable is related to the predictor variable.
•In this instance, it is not possible to conclude that one variable occurred prior to the other, so temporal precedence cannot be determined. Rather both variables ‘cause’ one another…
Analysis of Longitudinal Survey Data using Regression
Simplex Designs
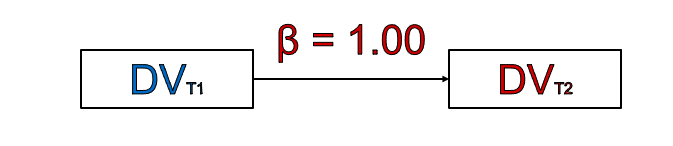
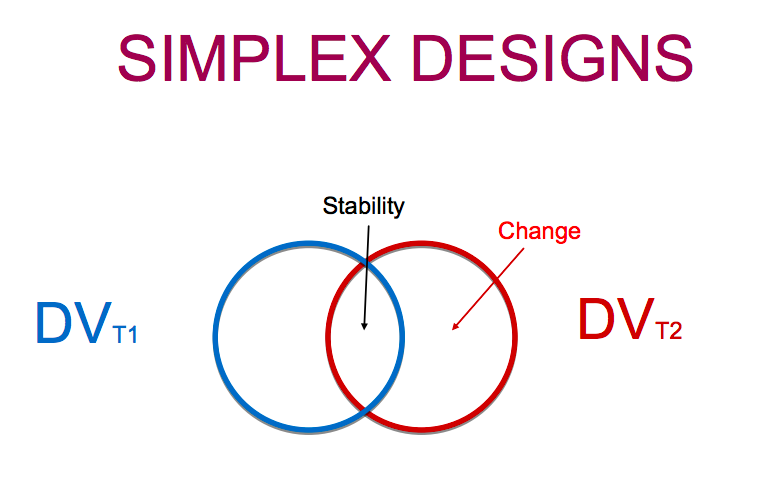
•Simplex designs, also known as autoregressive designs, involve regressing a variable on itself across time.
•In other words, the measurement of a variable at time 1 should predict time 2 (i.e., stability).
•This type of model is called autoregressive as the values of a scale are automatically regressed onto the same scale.
•This type of analysis allows researchers to explore the stability and change in one construct.
Simplex Design
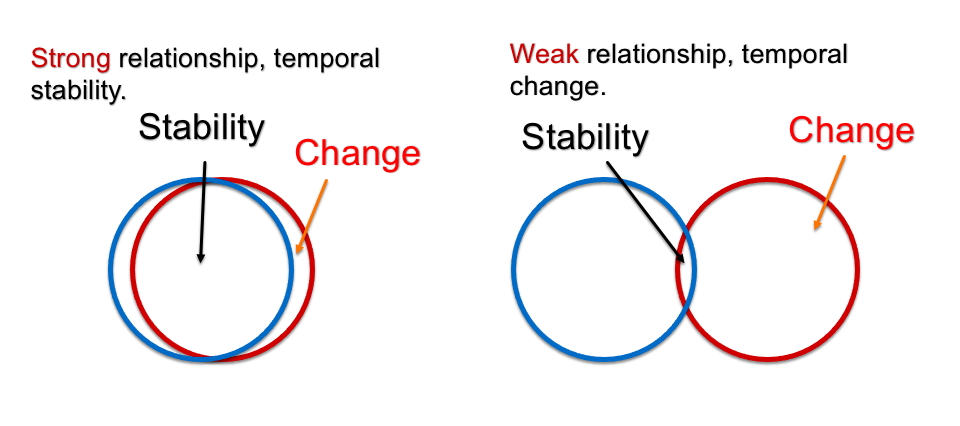
•A perfect association between the two time-points indicates that individual’s relative standings on the construct have not changed.
The rank-order of the participants remains the same. Participants with high T1 scores, will have high T2 scores (i.e., there is a high degree of stability from T1 to T2)
Across each of these explanations, the rank-order of the participants have not changed. Therefore, on a between-participant level (inter-individual), there is stability
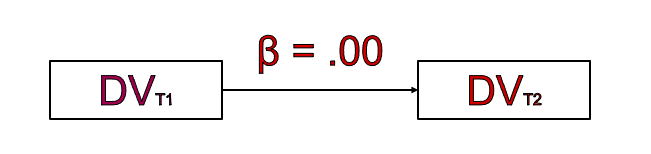
Simplex design
A small or zero association between the two time-points indicate that individual’s relative standings on the construct have changed dramatically (i.e., there is a lot of change from T1 to T2).
LONGITUDINAL CORRELATIONS
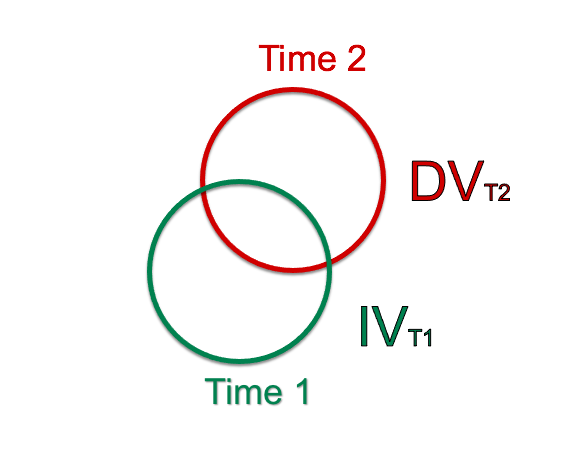
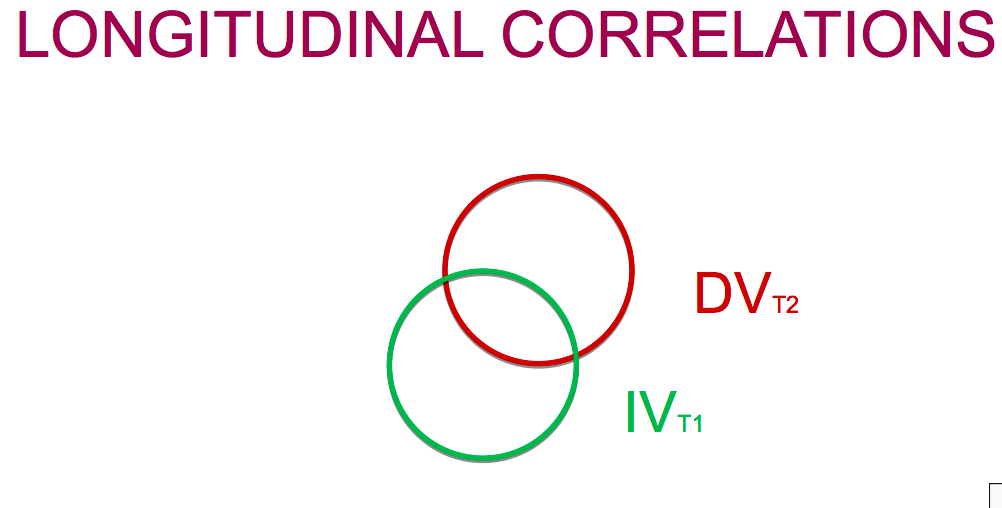
•Longitudinal correlations examine the relationship between the IV at time 1 and the DV at time 2.
•Similar to the correlations and bivariate regression techniques covered in this course, only two variables are analysed.
LONGITUDINAL CORRELATIONS
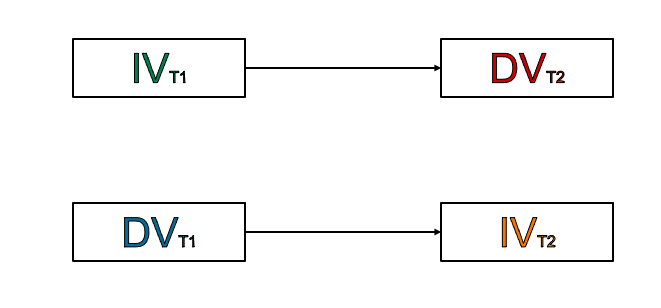
•In order to examine temporal precedence, researchers can run two separate longitudinal correlations.
•If the relationship between IV at time 1 and DV at time 2 is significant AND the relationship between the DV at time 1 with the IV at time 2 is not significant, it can be argued that temporal precedence has been found.
•If both analyses are significant, it may indicate a bi-directional relationship.
Weaknesses
•This analysis does not account for correlations between variables at each time point.
•Does not account for the stability in a construct.
There is no indication of the stability or change in the construct over time.
•The combination of these limitations ensure researchers cannot rule out that the relationship between T1 and T2 is simply due to a cross-sectional relationship.
Summary
We use longitudinal designs when collecting survey data in order to test for temporal precedence
We collect data for our variables at each time point
Simplex designs allow us to establish stability and change
Strong autoregressive associations show stability; weak autoregressive associations show change
Simplex designs do not establish temporal precedence
uLongitudinal correlations have been used to try to establish temporal precedence but not stability nor change
RESIDUALISED LONGITUDINAL REGRESSION
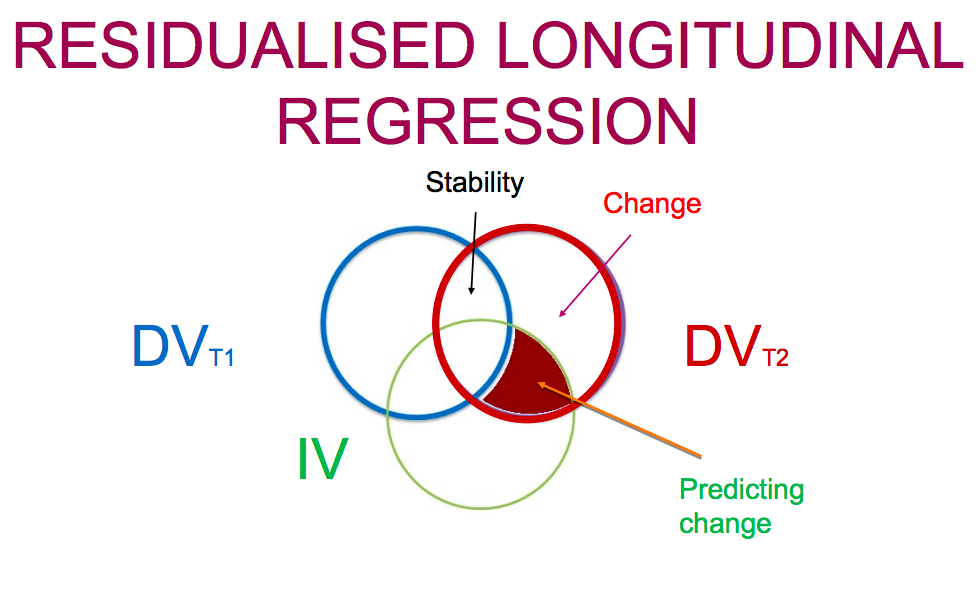
To address the limitations of longitudinal correlations, researchers can ‘residualise’ the DV.
This is done by entering the score of the DV at time 1 into the analysis.
As a result, the correlation between the DV across two time points is considered (i.e. the stability), and then statistically removed from the analysis
• This process allows researchers to ‘predict change.’
By entering the DV at time 1, the unique variance remaining in the DV at time 2, reflects the change in the construct over time
Residualised Londitudinal Regression
Strengths
The correlations between variables at T1 statistically controlled for.
The stability of the DV is accounted for.
Consequentially, this analytical technique allows a researcher to predict change (in other words, find a longitudinal effect).
Weaknesses
• Temporal precedence is still not identifiable because there is no test for bidirectional relationships.
Summary
Residualised longitudinal regression combines the strengths of the simplex design and the longitudinal correlation In this design the DV measure at T1 is entered into the analysis along with the IV to predict the DV measured at T2
This partitions the variance in the DV measured at T2 into variance shared with the DV measured at T1 (stability) and unique variance – the “residualised” variance (change)
The IV can then be used to predict change in the DV
This approach is limited in testing for temporal precedence as it cannot test for bi-directional relationships
CROSS-LAGGED MODELS
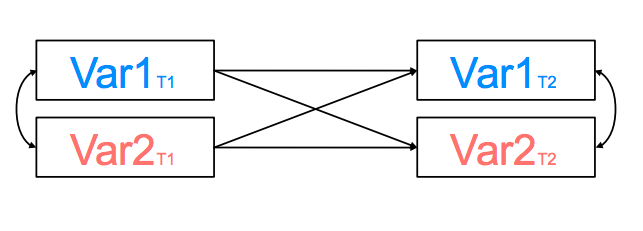
In cross-lagged models, the two measures serve as both the independent and dependent variable.
In this analysis, there is more than one DV
Cross-lagged models combine two residualised longitudinal regressions into the same analysis.
Thus, the stability of the construct is statistically removed, allowing each variable to predict the change in the other variable.
This technique allows an investigation of bidirectional effects.
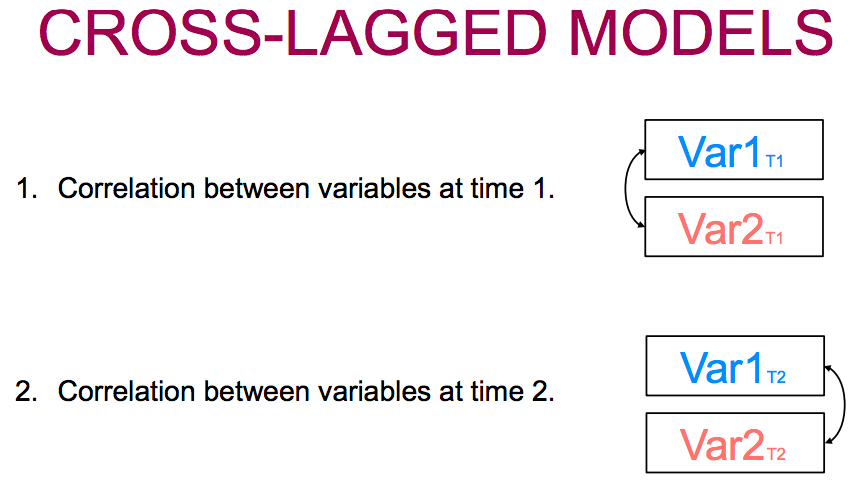
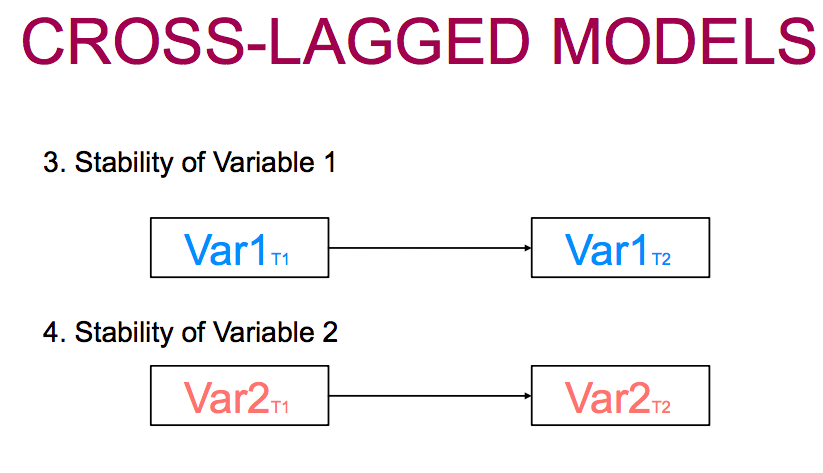
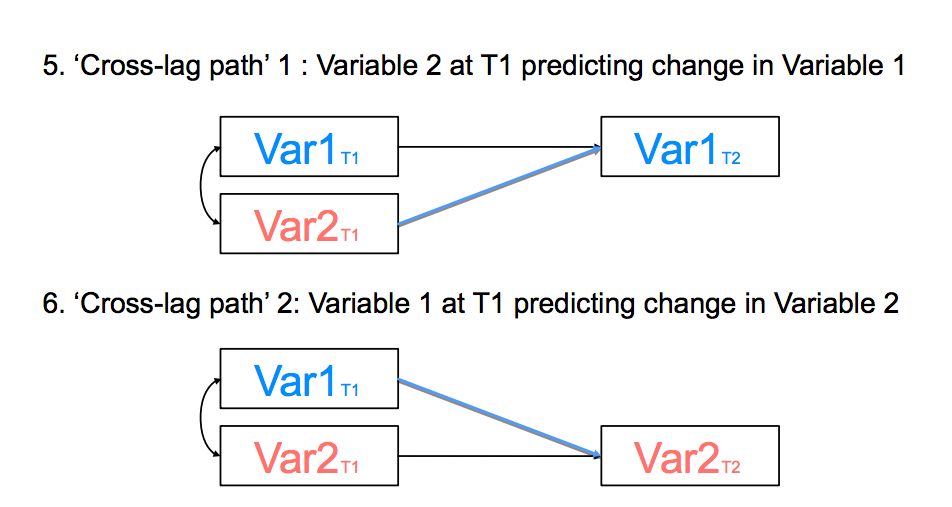
There are 6 parameters to a two-wave crosslagged model.
1. Correlation between variables at time 1.
2. Correlation between variables at time 2. Var1T2
3. Stability of Variable 1
4. Stability of Variable 2
5. ‘Cross-lag path’ 1 : Variable 2 at T1 predicting change in Variable 1
6. ‘Cross-lag path’ 2: Variable 1 at T1 predicting change in Variable 2
ASSUMPTIONS OF LONGITUDINAL ANALYSIS
Inter-individual stability
These techniques examine stability and change in the sample over time.
Thus, it is assumed that there are no systematic differences in the stability and change between the participants.
This assumption is violated when one group of participants changes faster or slower relative to the other participants.
Consistent Measurement
It is assumed that the measurement is the same when using repeated measures (i.e. the same measure over two or more time periods).
In practical terms, this means that the items administered to participants need to be exactly the same across time periods.
In conceptual terms, participants need to read and interpret the questions in exactly the same way across time periods.
Synchronicity
It is assumed that the administration of questionnaire occurs with the same interval between time periods for all participants.
CONSIDERATIONS OF LONGITUDINAL ANALYSIS
Timeframe
• In order to find a longitudinal effect, the length of time between measurements need to be considered.
The timeframe may be too short for a variable to impact another, and so you won’t find an effect.
The timeframe may be too long and the impact of one variable on the other may have dissipated
Other variables (third variable effect)
It is important to ensure that important variables are not omitted.
This idea is related to a causal process or pathway.
For this reason, it is easier to say that a variable at time 1 influences or impacts something, rather than causing it.
Summary
The cross-lagged design is the gold standard of panel designs
It overcomes the limitations of the previous designs by testing for uni-directional and bi-directional relationships The 2-wave cross-lagged design has 6 parameters:
Cross-sectional associations between the variables at T1 & T2
The association over the time for each variable (stability/change)
The cross-lag paths for each variable at T1 predicting the other at T2
The longitudinal design have several assumptions including: inter-individual stability; consistent measurement; synchronicity
Other considerations include the length of the timeframe and potential other variables
Página 14
Week 12
The Replication Crisis
WHAT IS THE REPLICATION CRISIS?
The Replication Crisis in Psychology
Originated in the early 2010s
Finding that research studies could not be replicated
Independent researchers following the same procedures as original studies could not find comparable results
Led to the ongoing questioning of established phenomenon and recommendations for the scrutiny of research practices
What triggered the Replication Crisis?
Bem (2011) Precognition - an ability to “feel the future”
Nine experiments:
Retroactive facilitation of recall
Recall of information (words) was better when never initially exposed to the information
This is contrary to everything we know about remembering information (e.g., rehearsal)
Encouraged other researchers to replicate the findings
Three replication attempts were made by other researchers
Not one could replicate the results
Coined the terms:
Questionable research practices (QRP’s)
p-hacking
Hacking data until you get the required p value to publish a study
E.g., Used a real dataset to demonstrate that listening to the Beatles song When I’m 64 made people younger
Obviously this is not possible (make people younger)
By using computer simulations to demonstrate that various decisions about data analyses made the results significant
Diederik Stapel • Nov 2011 • Fabricated data • 50 papers retracted
THE REPRODUCIBILITY PROJECT
“Reproducibility”
Reproducing results when reanalysing the original data
“Replication”
Replicating results from new data sets
Started in November 2011 by developing a protocol for selection and conduct of the replications.
270 contributing authors !
Looked at effect size as well as significance
Converted the results to correlations (recall this in the Person-Situation Debate?)
Only 36% of the replications were "successful" (i.e., produced p values < .05)
Summary of findings
Only 36% of the replications were "successful" (i.e., produced p values < .05).
The average effect size of the replications was around half that of the original studies.
Weaker, more surprising findings were less likely to replicate.
Social psychology findings were less than half as likely to replicate as findings in cognitive psychology.
REPLICATION CRISIS
A growing log of phenomenon that do not replicate
Stereotype threat
Ego-depletion
Power poses
Priming
The Stanford Prison experiment (this week’s podcast)
Why does this happen
Questionable Research Practices (QRP)
p-hacking
Removing participants
Not reporting all experimental conditions
HARKING
Hypotheses After the Results are Known
Publication bias
Small samples (in original studies)
Open Science
CHANGES TO THE FIELD
Led to a greater emphasis on Open Science:
Pre-registration
Open access to (deidentified) data
Open access to materials
Open access to results
PRE-REGISTRATION
Preregistration (aka unreviewed preregistration)
Researcher creates a detailed description of their plans for their study and records this is a timestamped, unedited archive
The plan can be shared with others
Registered Reports (aka reviewed preregistration)
Research submits a detailed proposal of their planned study to a journal for a review of the planned methods and analysis
Similar to Preregistration but addresses publication bias (results are published regardless of the outcome)
Some journals require this
Registered Replication Reports (RRR)
Similar to Registered Reports but focus on direct replication of original findings
Numerous labs follow the same preregistered plan and the results are reported collectively
E.g., ManyLab project
Open access to all data
All original data (deidentified) collected is placed in an online archive
Some funding agencies and journals make this a requirement
Materials used to inform the methodology is provided
Measures Ethics approvals
OPEN PRACTICES
Open access to decisions with “cleaning” data
Open access to analyses performed
Open access to preprints
Version of a journal article before it is typeset by the journal
Access to preprints
Sharing of code
And more
OPEN SCIENCE BACKLASH
A lot of backlash from established researchers (who typically benefit from flashy novel findings) as to this move to Open Science and the replication initiatives
“Tone”
"shameless little bullies”
"Methodological terrorists”
Información
- Descripción
- 1st grade 3003PSY Stats Apunte sobre 3003PSY Stats Notes, creado por Juliette Cross el 12/03/2021.
- Creado por
- Juliette Cross
- Visitas
- 4
- Valoración