15858794
Descripción
Test por Ethan Ross, actualizado hace más de 1 año
|
|
Creado por Ethan Ross
hace más de 5 años
|
|
Pregunta 1
Pregunta
Fisheries science
Fisheries management is all about modelling (predicting) the likely [blank_start]size or biomass of target[blank_end] fish species of distinct size/age classes
Critical factor is the [blank_start]recruitment[blank_end].
Recruitment – number of fish reaching a certain [blank_start]age/size[blank_end] or [blank_start]position in the life cycle[blank_end] - when they enter the fishery.
Respuesta
-
size or biomass of target
-
recruitment
-
age/size
-
position in the life cycle
Pregunta 2
Pregunta
Stock assessment
Fundamental basics – level of fishing [blank_start]mortality[blank_end] must be balanced by [blank_start]recruitment[blank_end] and [blank_start]growth[blank_end]
If max mortality level is exceeded, stock will [blank_start]fall[blank_end], and capacity to [blank_start]rebuild[blank_end] will be reduced
Respuesta
-
mortality
-
recruitment
-
growth
-
fall
-
rebuild
Pregunta 3
Pregunta
Important terms:
Recruit: A fish that [blank_start]survives[blank_end] from egg until reproductive (or legal fishery) age
[blank_start]Yield[blank_end]: numbers of fish (or value) produced by the recruits and available to the fishery
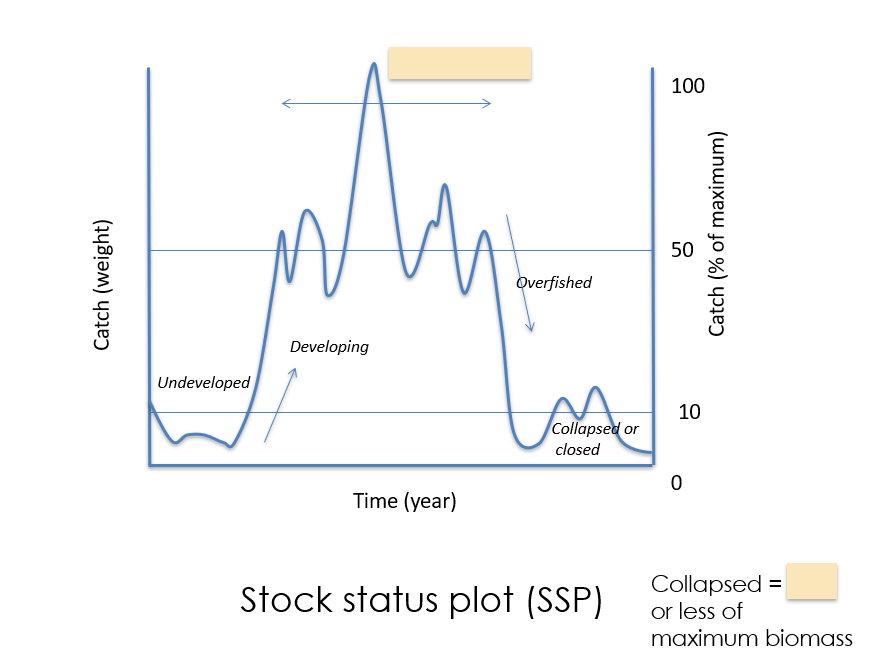
Collapse – point where a fished population or stock cannot [blank_start]sustain itself[blank_end]. May be arbitrarily set at [blank_start]10%[blank_end] of pre-fished biomass (or 50% MSY)
[blank_start]Stock[blank_end] – part of a species population that is reproductively isolated and managed as a single unit
Respuesta
-
survives
-
Yield
-
10%
-
Stock
-
sustain itself
Pregunta 4
Pregunta
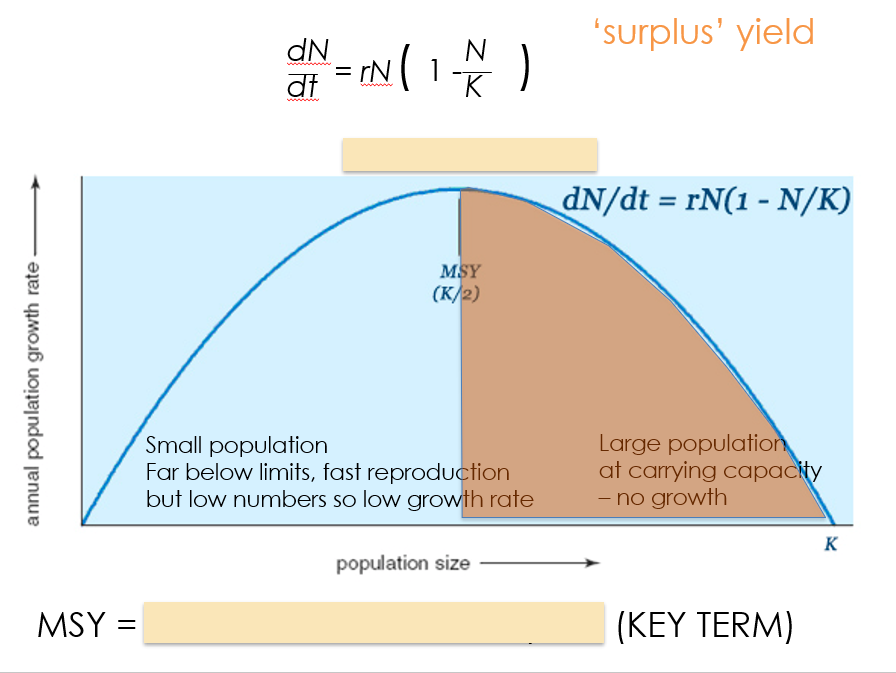
Fishery at MSY
In theory, fishing at MSY is desirable for all:
Keeps fishing level and stock size relatively high – approx. [blank_start]50%[blank_end] of maximum stock size
Management aim is to regulate fishing to keep population size at MSY
Respuesta
-
50%
Pregunta 5
Pregunta
Summary MSY and stock assessment
Typically fishing at MSY keeps the biomass lower (c. 50-75% lower) than the unfished biomass –
Fishing to MSY is risky – if the [blank_start]environment[blank_end] changes it can be easy to [blank_start]overestimate[blank_end] MSY
MSY usually estimated by species – but species interact: [blank_start]ecosystem[blank_end] approach may be better…
Respuesta
-
environment
-
overestimate
-
ecosystem
Pregunta 6
Pregunta
Growth in fish supply outpaces [blank_start]population growth[blank_end] (3.2% per year vs 1.6% per year)
Mostly met by aquaculture, mostly in [blank_start]China[blank_end]
Respuesta
-
population growth
-
China
Pregunta 7
Pregunta
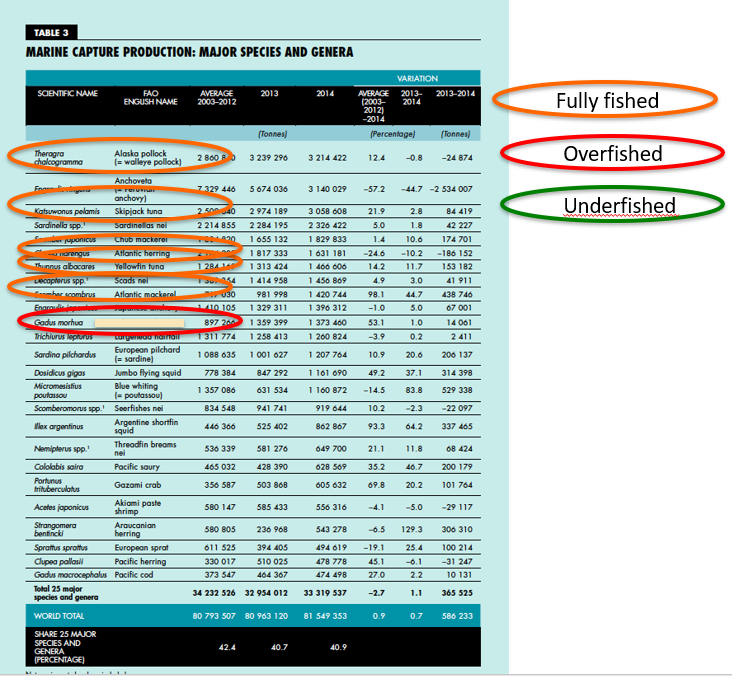
Global marine capture c. 80 million tonnes:
10% [blank_start]tuna and tuna-like[blank_end] species
Expansion in NW and WC Pacific, Indian Oceans, contraction in Atlantic and Mediterranean
[blank_start]58 Million[blank_end] people engaged in capture fisheries worldwide
Respuesta
-
tuna and tuna-like
-
58 Million
Pregunta 8
Pregunta
aquaculture
[blank_start]6%[blank_end] growth per year: 94 million tonnes in 2012, of which 66 Million tonnes is food fish, 23 Million tonnes aquatic algae.
China c. [blank_start]50%[blank_end] of global production
20 million people are engaged in aquaculture (>90% in China)
Respuesta
-
6%
-
50%
Pregunta 9
Pregunta
social
Fish capture and production large source of [blank_start]employment[blank_end] for women (especially in developing countries)
More than 15% primary capture employment women and up to 90% processing employment
Fishing and aquaculture assure livelihoods of c. [blank_start]10%[blank_end] of world’s population
Respuesta
-
employment
-
10%
Pregunta 10
Pregunta
Trends – doom and gloom?
Collapsed species
Fishing down food chain
Fishing deeper
Loss [blank_start]apex predators[blank_end]
PP utilized
Respuesta
-
apex predators
Pregunta 11
Pregunta
Types of fishery data:
Research survey - [blank_start]Highest resolution[blank_end] – direct measure of biomass for all species collected in the survey. Limited [blank_start]focus[blank_end], few comparative datasets
[blank_start]Stock assessment[blank_end] - Estimate of biomass for specific populations of species based on survey and catch effort data – only data on few targeted species
Catch data - Reported biomass of [blank_start]landed species[blank_end]. Global in scope, but does not reflect [blank_start]discards[blank_end] and IUU, and is influenced by accidental and deliberate [blank_start]mis-reporting[blank_end], changes in regulation and markets.
Respuesta
-
Highest resolution
-
focus
-
Stock assessment
-
landed species
-
discards
-
mis-reporting
Pregunta 12
Pregunta
Catch data do not track biomass because other things can influence catch (e.g. changes in [blank_start]restrictions[blank_end], market prices for specific species, [blank_start]fuel[blank_end] prices, vessel exclusions, population [blank_start]shifts[blank_end]).
Also, in a random stationary time series, maximum catch is likely to [blank_start]increase[blank_end] with a longer time series (so more chance of having collapse figures over time)
Respuesta
-
restrictions
-
fuel
-
shifts
-
increase
Pregunta 13
Pregunta
Summary so far
Estimating how many fish have been caught is difficult
Catch and effort data are biased in complex ways as these reflect [blank_start]socio-economics[blank_end] and [blank_start]geopolitics[blank_end] as well as ecology/biology
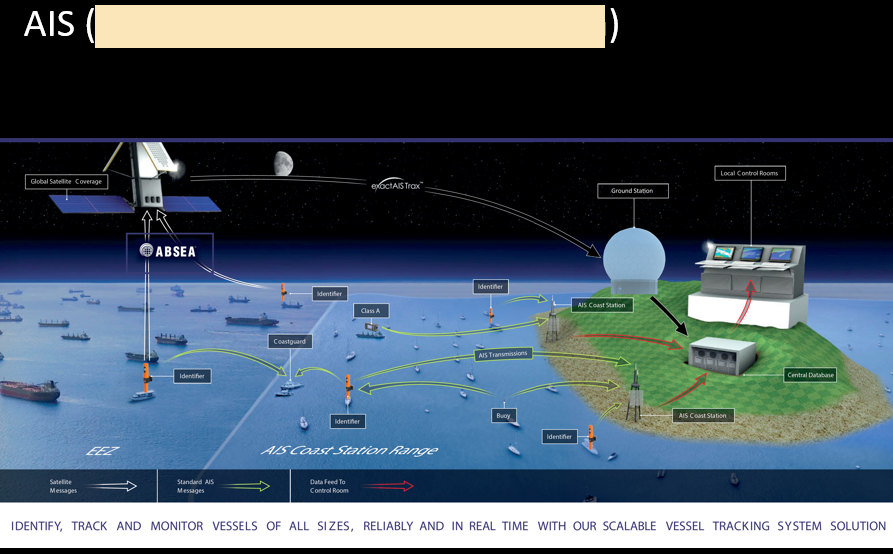
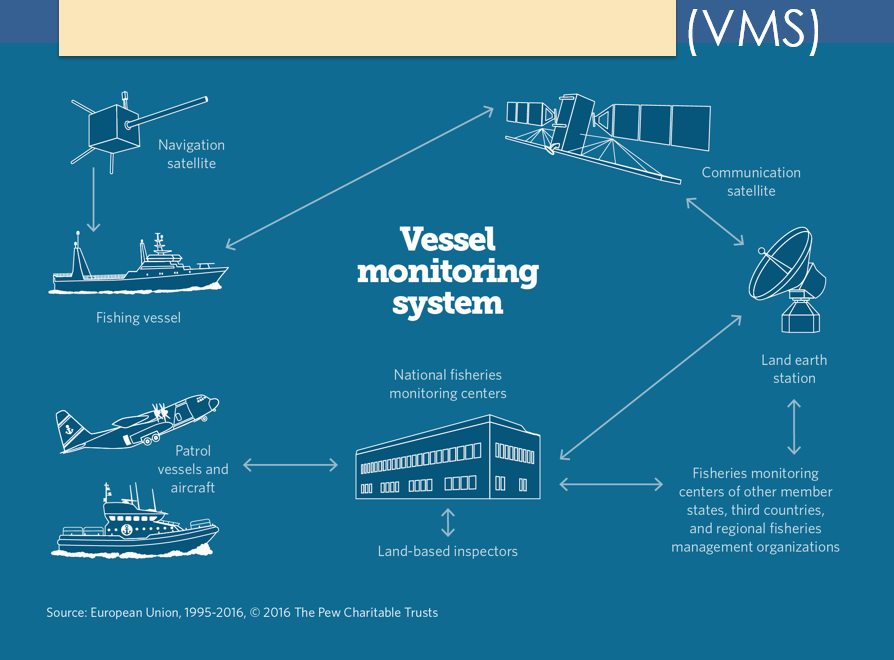
Satellite and big data approaches are changing the way we understand, measure and police global fishing efforts
Respuesta
-
socio-economics
-
geopolitics
Pregunta 14
Pregunta
Fishing effects
Direct removal of target species
Changes in [blank_start]size[blank_end] structure of target populations
Alterations to [blank_start]non-target[blank_end] populations of fish and benthos
Alterations to physical environment
Food chain effects (trophic [blank_start]cascades[blank_end], altered [blank_start]predation[blank_end] pressure)
Respuesta
-
size
-
non-target
-
cascades
-
predation
Pregunta 15
Pregunta
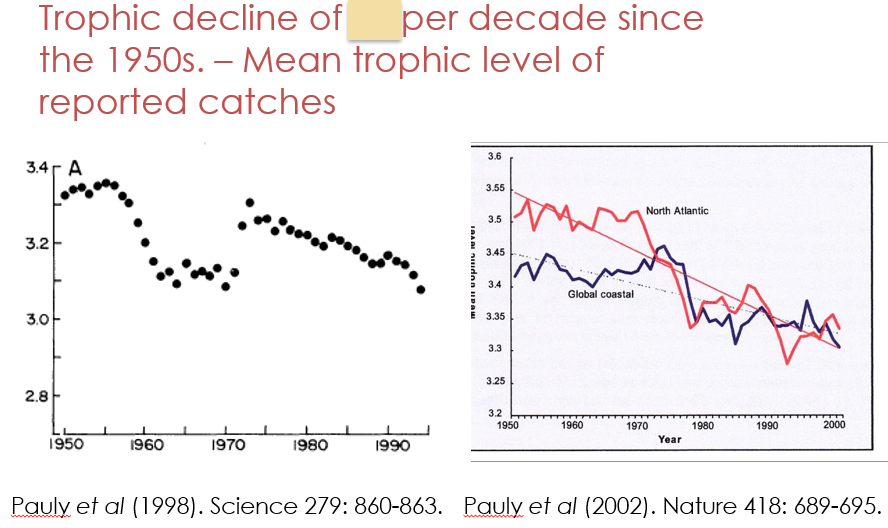
Fishing down (through) the food chain
Pauly et al (1998). Fishing Down Marine Food Webs. Science 279: 860-863.
Most food fish were trophic levels 4.0-4.5
Argument that we are now moving our predation [blank_start]down a trophic level[blank_end] from 4 to 3 (fishing down).
Also by removing predators, [blank_start]low[blank_end] trophic level biomass expands, decreasing mean TL (fishing through)
Respuesta
-
down a trophic level
-
low
Pregunta 16
Pregunta
Alternative : Catch TL is not the same as ecosystem TL
Theoretical comparison based on simulation ecosystem [blank_start]models[blank_end] (week 3)
Catch TL poor reflection of ecosystem TL when catch is [blank_start]selective[blank_end] within the food web
Respuesta
-
models
-
selective
Pregunta 17
Pregunta
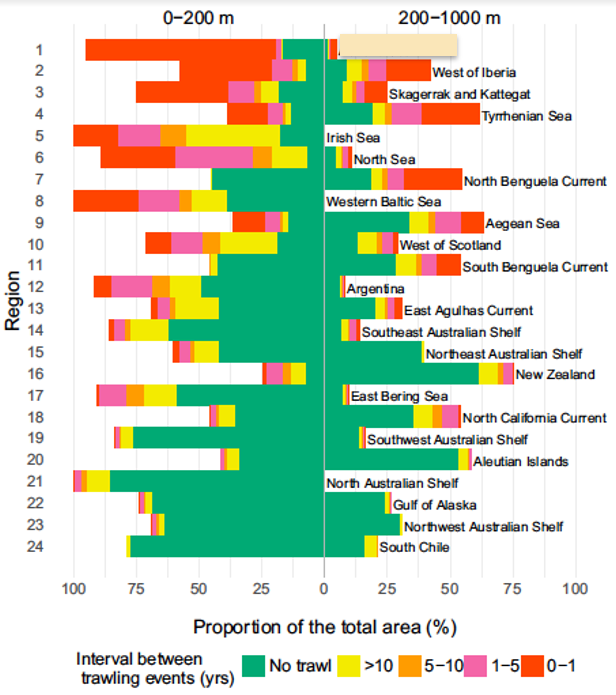
Recent data from research trawls are suggesting that deep-sea fish species (including by-catch) biomass is [blank_start]on the decline[blank_end].
Respuesta
-
on the decline
Pregunta 18
Pregunta
Summary: state of world fish
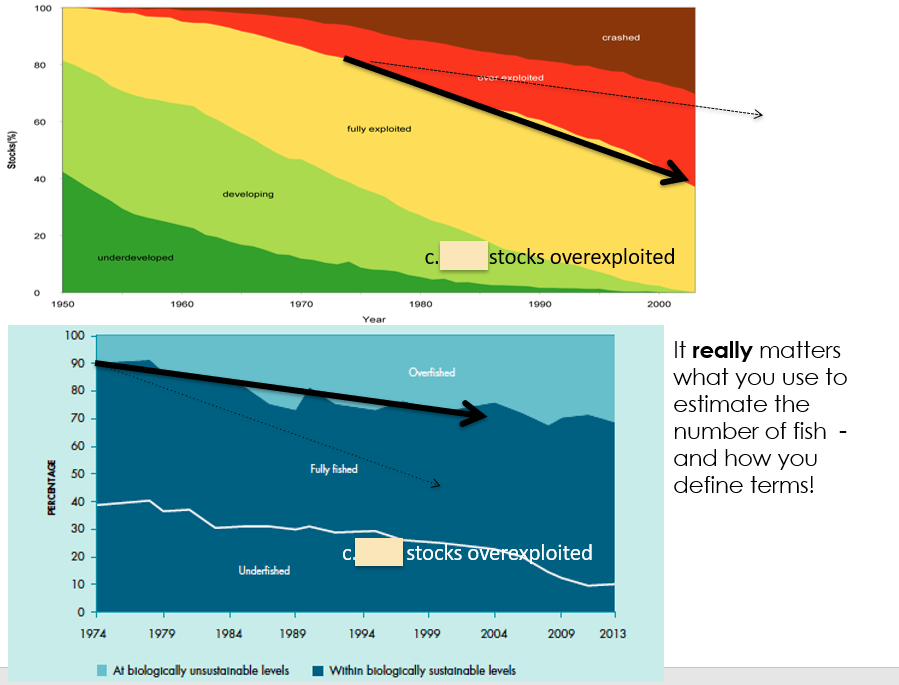
Globally, best estimate is that c. [blank_start]30%[blank_end] of fish stocks are over fished, [blank_start]60%[blank_end] are fully exploited, and 10% are underexploited
Aquaculture provides [blank_start]more[blank_end] fish than capture fisheries
Long history of management failure, stock collapse.
Current ecosystems have low [blank_start]abundance[blank_end] and [blank_start]diversity[blank_end] with [blank_start]small[blank_end] body sizes. Top predators heavily [blank_start]depleted[blank_end]
Catch data easily available but may give [blank_start]flawed[blank_end] picture of ecosystem state and trends
Rebuilding occurring in heavily regulated fisheries
[blank_start]Satellite[blank_end] vessel monitoring and big data processing give us a much richer view of fishing effort
More to be done in developing world fisheries
Respuesta
-
30%
-
60%
-
more
-
abundance
-
diversity
-
small
-
depleted
-
flawed
-
Satellite
Pregunta 19
Respuesta
-
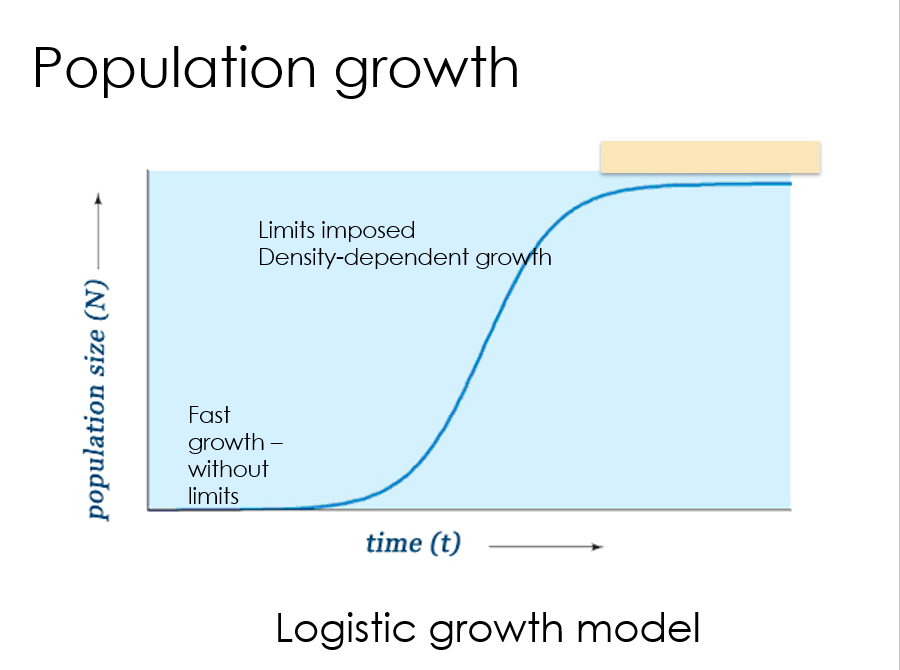
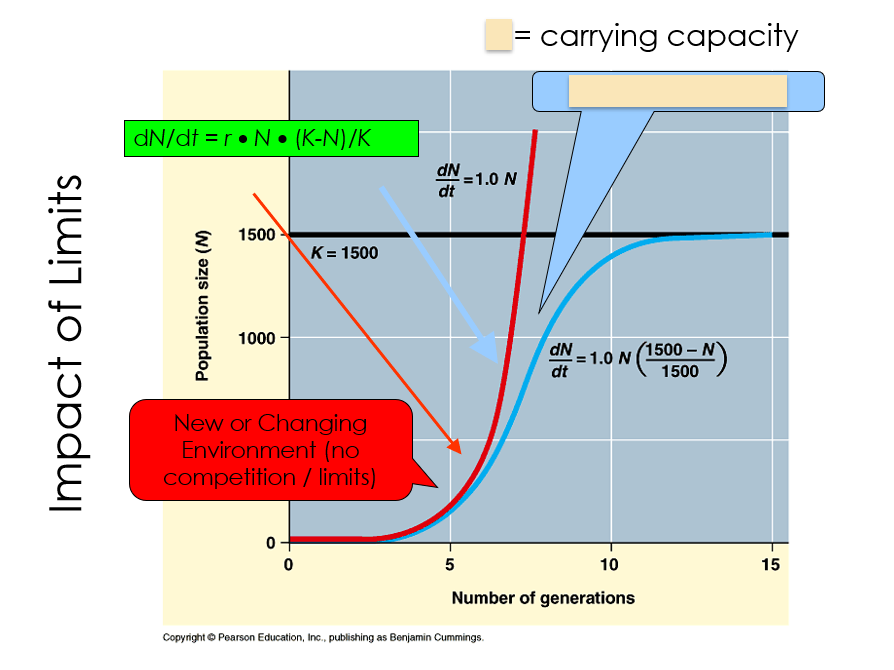
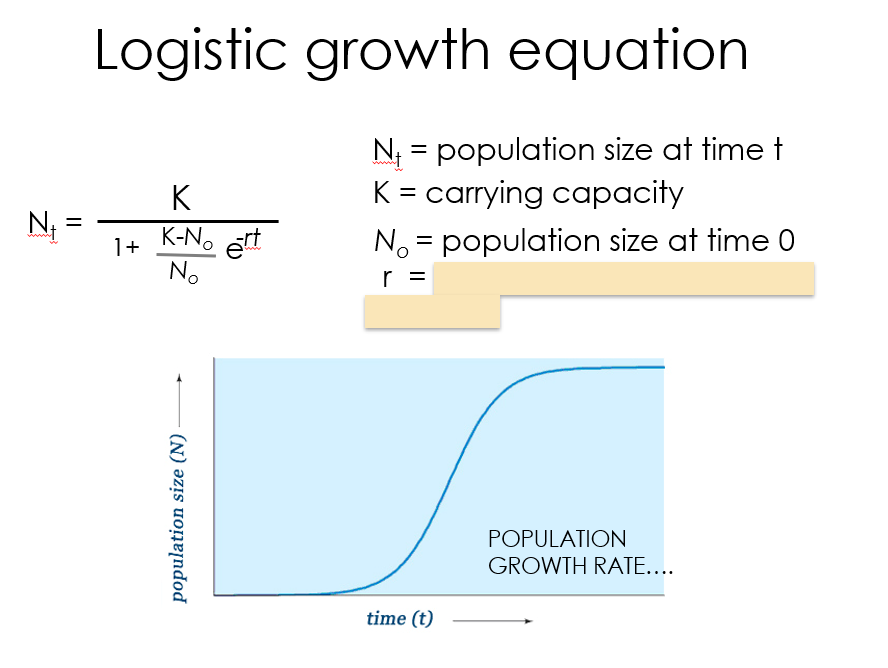
Carrying capacity
Pregunta 20
Respuesta
-
70%
-
30%
Pregunta 21
Respuesta
-
K
-
Imposition of limits
Pregunta 22
Respuesta
-
Fully exploited
-
10%
Pregunta 23
Respuesta
-
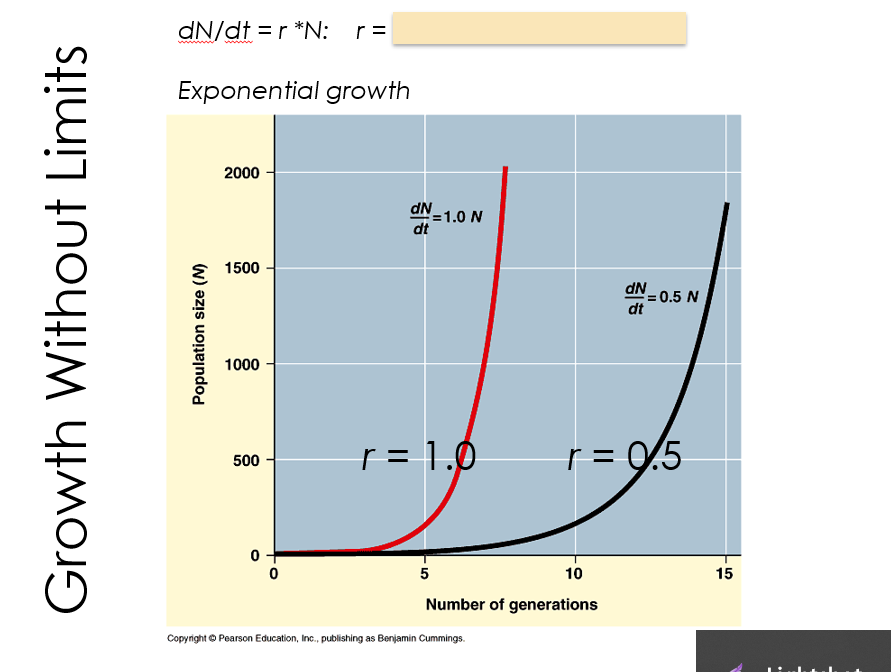
Intrinsic rate of population increase
Pregunta 24
Respuesta
-
Adriatic Sea
Pregunta 25
Respuesta
-
Atlantic Cod
Pregunta 26
Respuesta
-
Population growth rate
Pregunta 27
Respuesta
-
Maximum growth rate
-
Maximum sustainable yield
Pregunta 28
Respuesta
-
automatic Identification system
Pregunta 29
Respuesta
-
Vessel monitoring system
Pregunta 30
Respuesta
-
0.1
¿Quieres crear tus propios Tests gratis con GoConqr? Más información.