
Fichas
Lecture 1 Summary
Fichas del conjunto (17)
- 1What is a distribution?graphical representation that associates a frequency/ probability with each value of a variable
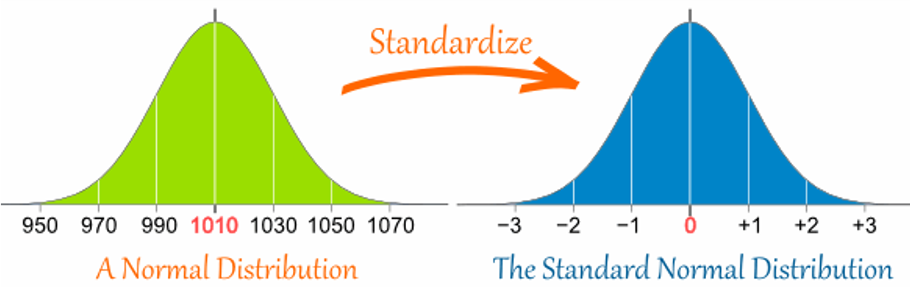
- 2Characteristics of a Normal Distribution?bell shaped
unimodal and symmetrical
mode=mean=median
tails extend indefinitely
although often can’t show this on graphs
area under the curve = 100% - 3the dependent variable is often assumed to be...normally distributed
i.e., for parametric tests - 4z-transformation transforms a normal distribution into a __standard normal distribution
it puts everything on the same scale - 5What does a Z score describe?how far a data point lies away from the mean, expressed in standard deviation units
- 6if you convert your raw scores into z-scores and plot the z-scores on a frequency distribution, it’s called a __ What is the mean and SD?standard normal distribution
mean = 0
SD = 1 - 7z-transformation the standard normal distribution--- 1. 2. 3.1. allows comparison of performance across different tests
2. tells you how many people score above or below you on a certain measure
3. allows you to make inferences concerning the probability that different scores will be obtained - 8IQ is normally distributed with M= SD=M=100
SD=15 - 9Standard Normal Distribution % between -1 and +1 SDs68.26%
- 10Standard Normal Distribution % between -2 and +2 SDs95.44%
- 11What is the Marshmallow Experimentthey could have 1 marshmallow now or wait the whole time and at the end get 2 marshmallows
- 12what is inferential statisticsusing sample data to make inferences about population parameters
- 13Inferential statistics samples may fail to provide good estimates of the population for two reasons, what are they?1) sampling error
2) sampling bias - 14What is a sampling error?no two samples from the same population are identical - by chance there is natural variation in scores (sampling error)
- 15What is sampling bias?Due to faulty sampling methods, some important subgroups of the population may be over- or under-represented in our sample
- Systematic variation (e.g., more women study Psychology) - 16Statistical inference is...the foundation of hypothesis testing
- 17Statistical inference allows us to... 1) determine the probability that a sample is ___ 2) allows us to test the ___ of a hypothesis as if a whole population was available instead of just a small but representative sample1) from one population and not another
2) truth
Información
- Descripción
- PSYC2010 Fichas sobre Lecture 1 Summary, creado por Hailey Brown el 08/04/2020.
- Creado por
- Hailey Brown · abr 2020
- Actualizado
- 8 abr 2020
- Visitas
- 4
- Valoración