
Fichas
Maths New GCSE
Fichas del conjunto (5)
- 1Maths GCSE : 1-9jhujji
- 2DataFrequency tables
Cumulative Frequency
Box Plots
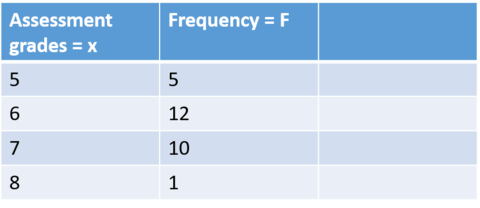
Histograms - 3Frequency Tables: averages from a frequency tableYou can find all the averages and Range from a frequency table.
Remind are self what the averages are:
Mean: add them all together and divide by how much data
Median: The middle data once in order of size
n+1 x 1/2
Mode: the most common data
Range; the highest data - the lowest data - 4Examples of averages from a frequency table: Find all the averages (and Range)Mean: 175/28= 6.25
Median: 6//n=( 28+1 x 1/2 = 14.5position)
Mode: 6
Range:3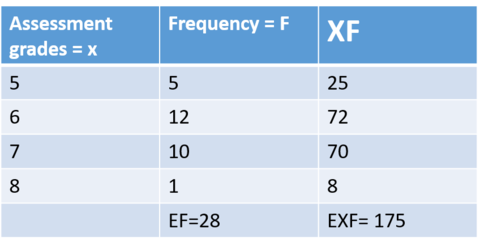
- 5If there is a group answer e.g OBefore anything you have to add a MIV (MID-interval value)
and then do MIVxF column instead of a FX
Información
- Descripción
- Includes DATA and more things will be added regularly
- Creado por
- Khaya Bhebhe · nov 2016
- Actualizado
- 20 abr 2017
- Visitas
- 8
- Etiquetas
- Valoración
Más sobre Mean, Median, Mode and Range