
Mapa mental
Big Data
Contenido del mapa
Big Data
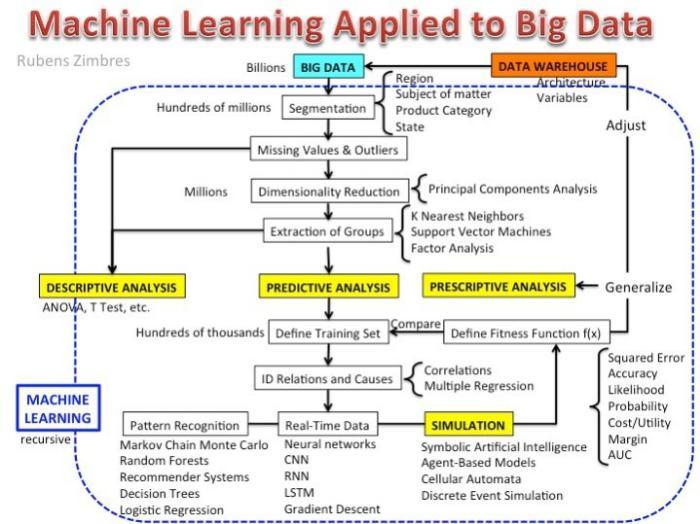
Machine learning
- lo que nos aporta es un conjunto de algoritmos catalogados como de Machine Learning o de Aprendizaje Automático cuyo objetivo es dotar a los computadores de la capacidad de aprender sin la necesidad de ser explícitamente programados.
- Supervised learning
- Supervised learning
- Unsupervised learning
Data mining
- Modelos predictivos
- BINARY CLASSIFICATION
- From my experience, binary classifi cation is the most common type of predictive model. Key decision makers for corporations and other organizations must often make critical decisions quickly, requiring a system to arrive at a yes/no decision with confi dence. These systems are not designed to do things part way or with some likelihood. They either do them or they do not. This is illustrated very well in the famous “go or no go for launch” checklist that each system’s fl ight controller must answer. A launch can proceed only after the fl ight director has run through each system and received the “go for launch” answer. In the business world, many decisions are binary, such as should I extend you credit for this car purchase, or will you respond to this marketing campaign. (Dean J. , 2014)
- MULTILEVEL CLASSIFICATION
- Multilevel or nominal classifi cation is very similar to binary classifi cation with the exception that there are now more than two levels. Nominal classifi cation is an extension of binary classifi cation. There are several examples where nominal classifi cation is common, but for the most part this is the rarest of targets. An example of such a model can be seen in the cell phone industry when looking at customer churn. A company may not only be interested in the binary response of whether an account remains active or not. Instead, it may want to dive deeper and look at a nominal response of voluntary churn (customer chooses to cancel the contract), involuntary churn (e.g., contract was terminated due to delinquent payments), or an active customer. (Dean J. , 2014)
- ASSESSMENT OF PREDICTIVE MODELS
- Classification
- ROC Receiver Operating Characteristic
- Lsft
- Gain
- AIC Akaike’s Information Criterion
- B ayesian Information Criterion
- KS Kolmogorov‐Smirnov
- INTERVAL PREDICTION
- is used when the target level is continuous on the number line. Salary is an example of a prediction that employers and employees alike would like to make accurately. The property and casualty insurance industry is an area with many interval prediction models. If you own a car in the United States, you are required to have insurance for it. To get that insurance, you likely requested a quote from several different insurance companies, and each one gave you a slightly different price. That price discrepancy is due to different predictive models and business factors that each insurance company uses. The business factors are the amount of exposure in certain geographic markets or an overall directive to try to gain market share in a certain market either geographic or economic strata. (Dean J. , 2014)
- BINARY CLASSIFICATION
- Metodología
- sEMMA
- sEMMA is a data mining methodology, created by SAS, that focuses on logical organization of the model development phase of data mining projects. It describes the process one must go through to capture insight and knowledge from their data. The acronym sEMMA—sample, explore, modify, model, assess—refers to the core process of conducting data mining. Beginning with a statistically representative sample of your data, sEMMA makes it easy to apply exploratory statistical and visualization techniques, select and transform the most signifi cant predictive variables, model the variables to predict outcomes, and confi rm a model’s accuracy. (Dean J. , 2014)
- sEMMA
- Técnicas predictivas comunes de modelado
- Aprendizaje supervisado
- RFM
- RFM, or recency, frequency, and monetary modeling, is a very simple but effective way to rank customers. It looks at how long since a customer’s last visit (recency), how often they purchase (frequency), or how much they spend (monetary). This method is desirable because it does not require sophisticated software or knowledge of “fancy” algorithms. (Dean J. , 2014)
- REGRESSION
- regression is the most dominant force in driving business decisions today. Regression analysis has many useful characteristics; one is the easy interpretation of results. Regression concepts are widely understood, and the methodology is well developed such that a well‐tuned regression model by a skilled practitioner can outperform many algorithms that are gaining popularity from the machine learning discipline.
- Generalized additive models (GAM)
- Locally estimated scatterplot smoothing (LOES)
- Orthogonal regression
- Partial least squares regression
- Proportional hazards regression
- Robust regression
- GENERALIZED LINEAR MODELS
- This generalizeddescription of models lifted the restrictions, which were prohibitive for certain types of problems, and offered the fl exibility to accommodate response variables that are nonnormally distributed, have a mean with a restricted range, and/or have nonconstant variance—which are all violations of the assumptions for OLS regression.
- NEURAL NETWORKS
- A neural network is simply a particular type of nonlinear function, and what is usually seen as a graphical representation is simply a diagram of that function.
- DECISION AND REGRESSION TREES
- ree‐based methods have long been popular in predictive modeling. Their popularity is owed, in no small part, to their simplicity and predictive power along with the small number of assumptions. T ree‐based methods of modeling have been around since the 1960s, with popular methods including CART, C4.5, and CHAID as common implementations. Decision trees were fi rst presented by Leo Breiman in his 1984 book Classifi cation and Regression Trees . The initial CART algorithm has been improved and extended in a number of ways through the years, but the overall principles remain.
- SUPPORT VECTOR MACHINES
- The original concept of SVMs is found in Estimation of Dependences Based on Empirical Data by Vapnik, in which the goal was to find optimal hyperplanes for linearly separable classes. 13 The result was that the optimal hyperplanes depended on only a small subset of the training data observations, which were called support vectors. In general, there is no one SVM algorithm; rather the term “support vector machines” refers to a general way of classifying data. Let us first look into a simple case of this original support vector machine formulation
- BAYESIAN METHODS NETWORK CLASSIFICATION
- BAYESIAN METHODS NETWORK CLASSIFICATION
- A Bayesian network is a graphical model that consists of two parts, G, P, where G is a directed acyclic graph (DAG) whose nodes represent random variables and arcs between nodes represent conditional dependency of the random variables and P is a set of conditional probability distributions, one for each node conditional on its parents. The conditional probability distributions for each node may be prior or learned. When building Bayesian networks from prior knowledge alone, the probabilities will be prior (Bayesian). When learning the networks from data, the probabilities will be posterior (learned).
- Naive Bayes Network
- ENSEMBLE METHODS
- An ensemble model is the combination of two or more models. Ensembles can be combined in several ways. A common and my personal preference is a voting strategy, where each model votes on the classifi cation of an observation and then in a democratic fashion the classifi cation with the most votes win. Another strategy is to average the predictions from the different methods to make a numeric prediction.
- Bagging
- is the most straightforward of ensemble methods. Simply stated, it takes repeated unweighted samples from the data. Each observation can be included in a sample only once (without replacement within a sample), but observations are eligible to be included in all samples (sampling with replacement across samples).
- Boosting
- Boosting is very similar to bagging but with the major difference that in boosting, reweighting occurs after each sample model is fi t to “boost” the performance of the weak model built on the sampled data. The weights of the misclassifi ed observations are increased so that they are more likely to be selected and therefore be exploited by a subtle relationship in the data. This normally has an improved effect on the overall model when comparing boosting results with bagging results. The trade‐off is that boosting must be done in a sequential manner because of the reweighting while bagging can be done in parallel, assuming you have suffi cient system resources. In my personal experience, I tend to use boosting for classifi cation models and bagging for interval prediction models
- RFM
- Aprendizaje no supervisado
- Segmentation
- Segmentation is a collection of methods used to divide items, usually people or products, into logical mutually exclusive groups called segments. These segmentation methods include several functions for identifying the best variables to be used in defi ning the groups, the variables to be used in analyzing these groups, assigning observations to the clusters, analyzing/validating these clusters, and profiling them to see the common characteristics of the groups. A well‐defi ned segment has the following features: ■ It is homogeneous with respect to a similarity measure within itself. ■ It is distinct from other segments with respect to that similarity measure.
- CLUSTER ANALYSIS
- Clustering is the process of organizing objects into self‐similar groups by discovering the boundaries between these groups algorithmically using a number of different statistical algorithms and methods. Cluster analysis does not make any distinction between dependent and independent variables. It examines the entire set of interdependent relationships to discover the similarity relationships between the objects in order to identify the clusters. Cluster analysis can also be utilized as a dimension reduction method in which the number of objects are grouped into a set of clusters, and then a reduced set of variables are used for predictive modeling. This practice helps reduce issues related to multicollinearity.
- Unsupervised clustering.
- Semisupervised clustering.
- Supervised clustering.
- K‐MEANS ALGORITHM
- K‐means is one of the most widely used clustering techniques because of its simplicity and speed. It partitions the data into k clusters by assigning each object to its closest cluster centroid (the mean value of the variables for all objects in that particular cluster) based on the distance measure used. It is more robust to different types of variables. In addition, it is fast for large data sets, which are common in segmentation.
- HIERARCHICAL CLUSTERING
- Hierarchical clustering generates clusters that are organized into a hierarchical structure. Visualizing this hierarchical structure can be used to understand the structure of clusters in the data set in addition to the clusters themselves. This technique only requires a measure of similarity between objects. It does not require you to specify the number of clusters. You can obtain any number of clusters by cutting the hierarchical structure at a proper level.
- Segmentation
- Aprendizaje supervisado
- Modelos predictivos
El internet de cosas
Desarrollo de SW
Modelo de negocios
- Algoritmos predictivos
Sistemas distribuidos
- FILE SYSTEM COMPUTING
- Hadoop with its many distributions and tools that are compatible with its fi le system, such as Hive, MapReduce, and HBase. Hadoop was created by Doug Cutting and Mike Cafarella. It was initially developed in 2004 In 2008, Hadoop had become a toplevel Apache project and was being used by several large data companies such as Yahoo!, Facebook, and The New York Times. (Dean J. , 2014)
- Hadoop
- FILE SYSTEM COMPUTING
Analytical Tools
- WEKA
- Weka (Waikato Environment for Knowledge Analysis) is an open source data mining offering, fully implemented in Java, and primarily developed at the University o f Waikato, New Zealand. Weka is notable for its broad range of extremely advanced training algorithms, However, Weka does not scale well for big data analytics, as it is limited to available RAM resources, typically on one machine. (Dean J. , 2014)
- R
- R is an open source fourth‐generation programming language designed for statistical analysis. (Dean J. , 2014)
- PYTHON
- SAS
- SAS is the leading analytical software on the market. The SAS system is divided into two main areas: procedures to perform an analysis and the fourth‐generation language that allows users to manipulate data. This is known as the DATA Step. (Dean J. , 2014)
- Java and JVM
- WEKA
Imágenes y archivos del mapa
Información
- Descripción
- Doctorado Mapa Mental sobre Big Data, creado por Eduardo Hinojosa el 08/09/2017.
- Creado por
- Eduardo Hinojosa
- Visitas
- 3
- Valoración