
Mapa mental
Population Dynamics
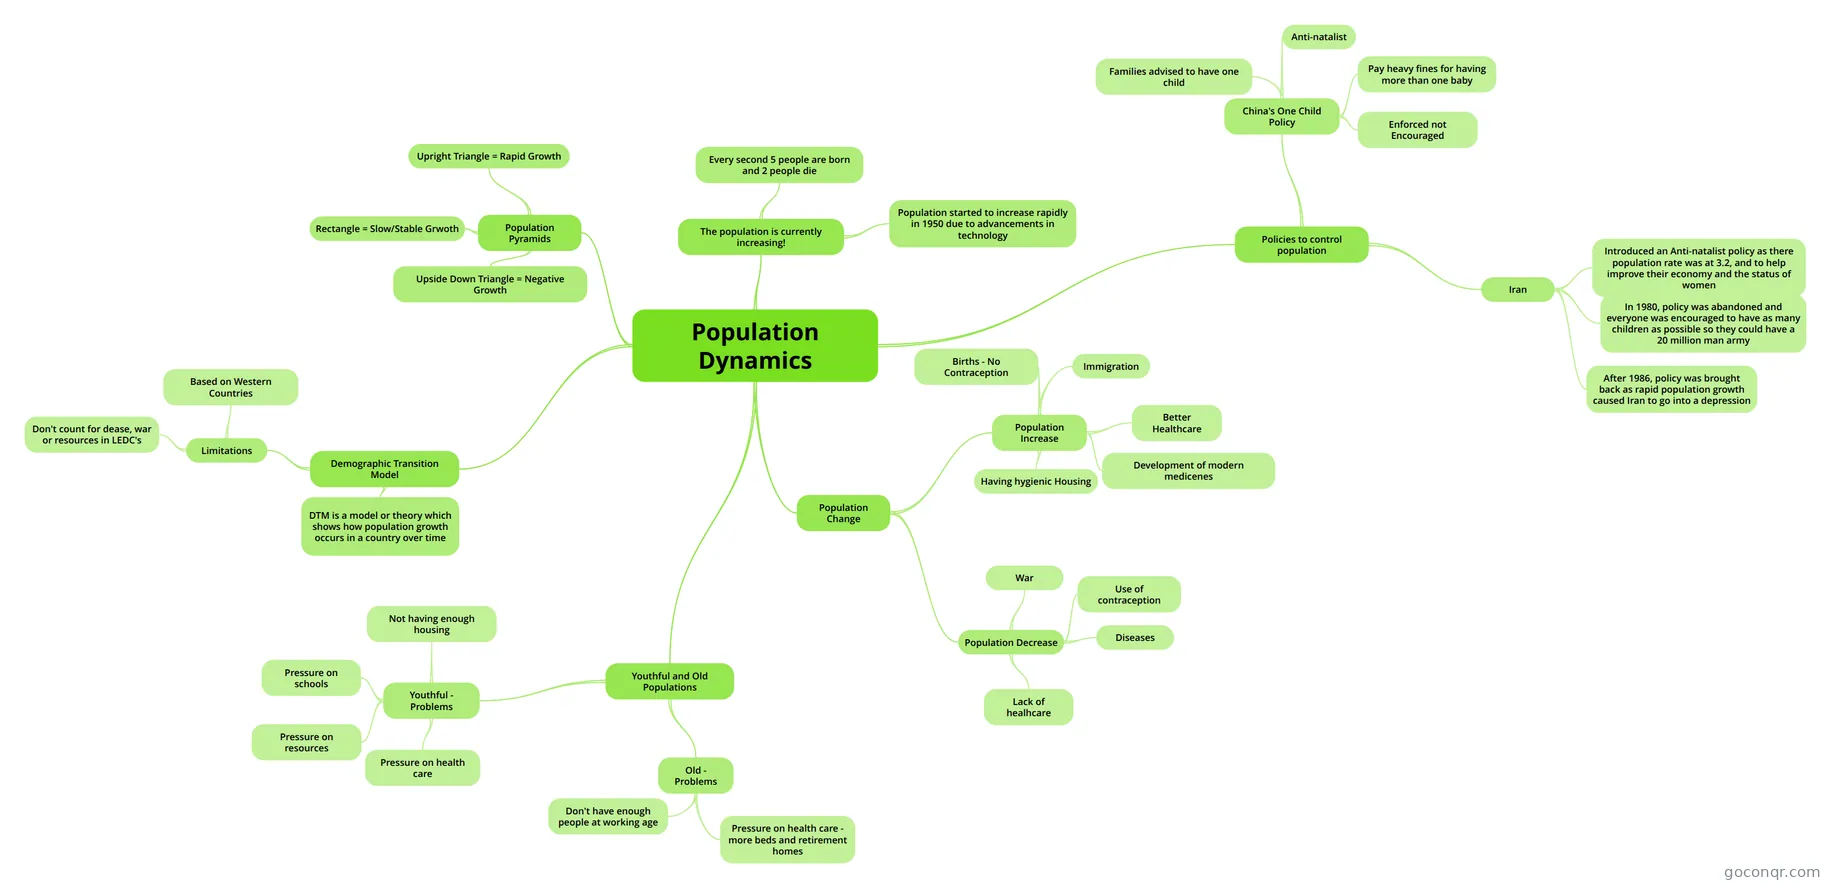
Mind map: Population dynamics
Contenido del mapa
Population Dynamics
The population is currently increasing!
- Every second 5 people are born and 2 people die
- Population started to increase rapidly in 1950 due to advancements in technology
Population Change
- Population Increase
- Births - No Contraception
- Immigration
- Better Healthcare
- Development of modern medicenes
- Having hygienic Housing
- Population Decrease
- War
- Use of contraception
- Diseases
- Lack of healhcare
- Population Increase
Population Pyramids
- Upright Triangle = Rapid Growth
- Rectangle = Slow/Stable Grwoth
- Upside Down Triangle = Negative Growth
Demographic Transition Model
- DTM is a model or theory which shows how population growth occurs in a country over time
- Limitations
- Based on Western Countries
- Don't count for dease, war or resources in LEDC's
Youthful and Old Populations
- Youthful - Problems
- Not having enough housing
- Pressure on schools
- Pressure on resources
- Pressure on health care
- Old - Problems
- Pressure on health care - more beds and retirement homes
- Don't have enough people at working age
- Youthful - Problems
Policies to control population
- China's One Child Policy
- Families advised to have one child
- Anti-natalist
- Pay heavy fines for having more than one baby
- Enforced not Encouraged
- Iran
- Introduced an Anti-natalist policy as there population rate was at 3.2, and to help improve their economy and the status of women
- In 1980, policy was abandoned and everyone was encouraged to have as many children as possible so they could have a 20 million man army
- After 1986, policy was brought back as rapid population growth caused Iran to go into a depression
- China's One Child Policy
Información
- Descripción
- (Population Dynamics) Geography Mapa Mental sobre Population Dynamics, creado por Matthew Jones el 03/09/2013.
- Creado por
- Matthew Jones
- Visitas
- 245
- Etiquetas
- Valoración