
Mapa mental
1.4-- Presenting & Evaluating Data
Contenido del mapa
1.4-- Presenting & Evaluating Data
PRESENTING DATA
- After you have completed your experiment . The data collected needs to be organised and presented.
- There are many ways to present and process data. Including tables, graphs, flow charts, pictures or diagrams. tThe best way to present data depends of the type of data you have collected.
- After you have completed your experiment . The data collected needs to be organised and presented.
PRESENTING DATA IN A TABLE
- Tables provide an accurate record of numerical values and allow you to organise your data. Tables usually present data in either columns or rows.
- Tables should have the following features: Descriptive title including the independent and the dependent variables-- coulmn headings--- the independent V. placed in the left column and the dependent V. is placed in the right column.
- Tables provide an accurate record of numerical values and allow you to organise your data. Tables usually present data in either columns or rows.
PRESENTING DATA AS A GRAPH
- Presenting data in a graph form visually displays any patterns or trends. It is usually appropriate to use tables when making a graph.
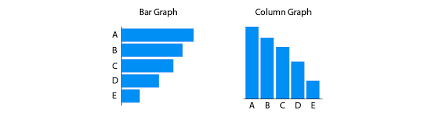
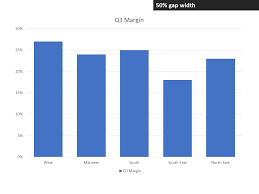
- A column graph is the most appropriate when making a graph for discrete (discontinuous) data.
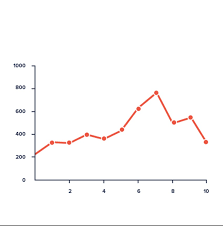
- Another way to present data in a graph form is with a line graph.
- A line graph is a way to represent continuous quantitative data
- In a line graph the values are plotted across the whole graph and then a line is drawn through the series of points.
- A line graph is a way to represent continuous quantitative data
- Presenting data in a graph form visually displays any patterns or trends. It is usually appropriate to use tables when making a graph.
INTERPRETING DATA
- After you have displayed your data you need to be able to interpret results.
- Refer to measurements as evidence, and draw conclusions from the data. Make sure the conclusion is supported by the data.
- Refer to the evidence you have gathered. And use phrases such as "This data shows that..."
- Refer to measurements as evidence, and draw conclusions from the data. Make sure the conclusion is supported by the data.
- After you have displayed your data you need to be able to interpret results.
Descriptive Statistics
- Data can be organised using descriptive statistics. These are used to summarise, organise and describe data obtained from data. This allows the data to be interpreted easily. this can be used to analyse both quantitative and qualitative data. Descriptive stats includes using percentages, graphs, and measures of central tendency.
- Measures of central tendency (measures of central location) are single values that allow you to describe the central position in a set of data. Ex. The mean, median and mode are all measures of central tendencey
- Percentage change apples to increase and decrease relative to the control or starting point of the measurement.
- Percentage difference which can also be expressed as a fraction, is a measure of precision of two measurements.
- Range is the difference between the highest and lowest number.
- Uncertainty in measurements should be reported along side your average
EVALUATING THE METHOD
- In your report you should acknowledge any errors that couldn`t be eliminated.
- Systematic error occurs because of the way that an experiment has been designed. They will make the results consistently high or low. A common form of systematic error is called zero error.
- Random error are unpredictable errors that can occur in all experiments. They occur because no measurement an be absolutely exact.
- MISTAKES ARE NOT ERRORS-- mistakes can be avoided while errors cannot be .
- Discussions of results
- Composes of two factors. First it explains the results and second it explains the significance of the experiment.
- In your report you should acknowledge any errors that couldn`t be eliminated.
WRITING A CONCLUSION
- Your conclusion should be one or two paragraphs long. These paragraphs need to link to the evidence to your hypothesis. t should also provide the answer to your question. And it should clearly state the whether your hypothesis was correct or not.
- Do not include any irrelevant information or new information.
- Your conclusion should be one or two paragraphs long. These paragraphs need to link to the evidence to your hypothesis. t should also provide the answer to your question. And it should clearly state the whether your hypothesis was correct or not.
Imágenes y archivos del mapa
Información
- Descripción
- Mapa Mental sobre 1.4-- Presenting & Evaluating Data, creado por Rokaya Alshaibani el 13/02/2021.
- Creado por
- Rokaya Alshaibani · feb 2021
- Actualizado
- 13 feb 2021
- Visitas
- 0
- Valoración