
Mapa mental
Bivariate statistical measures regression and correlation
Contenido del mapa
Bivariate statistical measures regression and correlation
Bivariate measures are those that study the relationship that may exist between two variables analyzed simultaneously.
- for this reason it is known as two-dimensional distributions or bivariate data
- Unlike univariate data, it focuses on the analysis of one variable with independent parameters.
Correlation and regression analysis
- analyzes how two or more quantitative variables in a set of data are related to each other
- One way in which these analyzes are implemented is to explain how one variable is related in terms of the other.
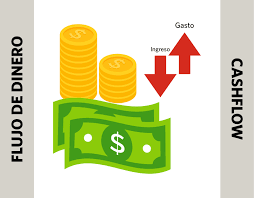
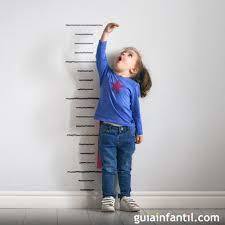
- For example when talking about the existing relationship between production and consumption; income and expenses; weight and height
- The relationship between the variables can be classified into:
- one-sided causal dependence
- one of the variables influences the other, but not the other way around
- interdependence
- there is an influence between two variables reciprocally
- direct dependency
- show a correlation by means of a third variable
- agreement
- is presented in two independent variables where a correlation is determined
- chance covariation
- correlation between the two variables
- one-sided causal dependence
- When interpreting the results, it is important to keep in mind:
- the correlation coefficient
- allows to know the degree of correlation between the variables
- the coefficient of determination
- measures the reliability of the model
- the correlation coefficient
- The relationship between the variables can be classified into:
- For example when talking about the existing relationship between production and consumption; income and expenses; weight and height
- One way in which these analyzes are implemented is to explain how one variable is related in terms of the other.
- Correlation analysis
- gives a number that summarizes the degree of relationship between the variables
- the correlation coefficient has two properties which establish the nature of the relationship
- these are its sign and magnitude
- when the values are close to -1 or +1 they indicate that the values are close to the line or below it and when the values are close to 0 it suggests a greater dispersion
- these are its sign and magnitude
- the correlation coefficient has two properties which establish the nature of the relationship
- gives a number that summarizes the degree of relationship between the variables
- regression analysis
- Give the mathematical equation that describes the relationship
- another use of the regression equation is to predict future values for a variable
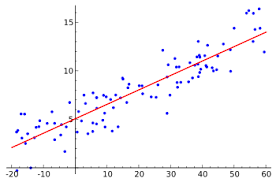
- regression analysis allows obtaining ideal knowledge as a regression line, which describes the relationship or dependence between variables
- where it is necessary to use a measure that is known as the correlation coefficient
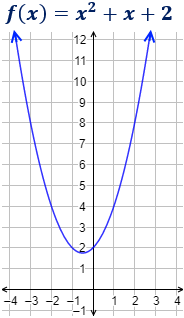
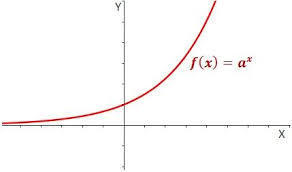
- In addition, it indicates whether the mathematical relationship is linear, parabolic, exponential, etc.
- In addition, it indicates whether the mathematical relationship is linear, parabolic, exponential, etc.
- where it is necessary to use a measure that is known as the correlation coefficient
- regression analysis allows obtaining ideal knowledge as a regression line, which describes the relationship or dependence between variables
- another use of the regression equation is to predict future values for a variable
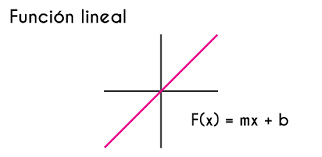
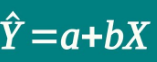
- Generally, when we talk about regression analysis, a straight line is used for mathematical calculation.
- This model indicates that a linear relationship occurs when the value of y is a function of x
- This model indicates that a linear relationship occurs when the value of y is a function of x
- Generally, when we talk about regression analysis, a straight line is used for mathematical calculation.
- Give the mathematical equation that describes the relationship
- In these measurements, scatter diagrams are very important since they easily show the relationship between quantitative variables.
- analyzes how two or more quantitative variables in a set of data are related to each other
Imágenes y archivos del mapa

Información
- Descripción
- Mapa Mental sobre Bivariate statistical measures regression and correlation, creado por María stefanny Sanchez Pinzón el 25/10/2022.
- Creado por
- María stefanny Sanchez Pinzón
- Visitas
- 3
- Valoración