
Mapa mental
Week4
Contenido del mapa
Week4
Statistical testing
- A statistical test is run to determine if the observed differences between the compared estimates (e.g., means, difference-in-means, proportions, etc.) are statistically significant. • In other words, we want to know whether the observed difference between the group estimates is different than what would be expected by chance alone.
- Before you decide which statistical test to use, recall the following: 1) the scale of the dependent variable (e.g., categorical, ordinal or continuous), 2) the distribution of the dependent variable (e.g., normal distribution, t distribution, F distribution, chi-square distribution, etc.), 3) the number of dependent (what you are measuring) and independent variables, and 4) the nature of compared groups (e.g., matched or unmatched).
Parametric tests:
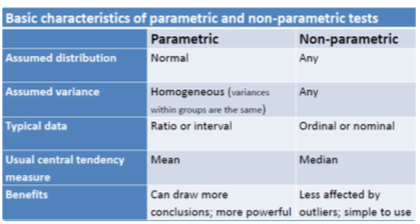
- Test hypotheses based on the assumption that the samples come from populations that are normally distributed
- Parametric statistical tests assume that there is homogeneity of variance (variances within groups are the same).
- The level of measurement for parametric tests is assumed to be interval, or ratio.
Non parametric: when conditions stated in previous slide are not met, parametric tests cannot be used.
- When to use a non-parametric test? • When the distribution of the outcome variable is not Normal. Normality can be assessed by drawing a histogram or running tests such as the Shapiro-Wilk test • Sample is small • The outcome variable is ordinal or rank or nominal • Outliers present • Tool collecting data is inaccurate – not accurate enough to detect beyond some limits
differences between groups-independent.
- Indepdnant t test: used to determine if there is a difference between the means of two independent grapes on a continuous dependant variable.
- with this test you are trying to find if the difference between the means is as a result of sampling variation or if a 'real' difference exists in the population you want to infer to.
- Mann-Whitney U test: is a ran based non-paremtirc test that can be used to determine the difference between two the medians of two groups on a continuous or ordinal scale.
- this test is helpful if you don't have normally distributed date or an ordinal dependant variable.
- Indepdnant t test: used to determine if there is a difference between the means of two independent grapes on a continuous dependant variable.
Interpreting t results
- Scenario: 28 children with CP were randomly divided into two groups. Neurodevelopmental therapy was given to the first group (n=15) and compared to a control group (n=13). All children were assessed using the Gross Motor Function Measure (GMFM) at baseline and post-treatment at 3 months
- an independent sample t-test was used for comparison of the means between the two groups.
Man-Whitney U test.
- this test is based on the ranking of measurements from two samples to estimate whether the samples are from the same population - no assumptions are made about the distribution of the measurements in either group.
- e.g. do babies who have an infection stay longer in the NICU?
Differences between groups-paired.
- Paired T test Used to test if the mean difference between paired observations is statistically significantly different from 0. • Trick – to check normality for this test it must be done on the difference variable. i.e. outcome at time 1 – outcome at time 2
- Wilcoxon signed-rank testAlso known as the Wilcoxon matched pairs test and is used when the normality of the differences is concerning and the sample size is small. • In this test it looks at the absolute differences between the paired scores and ranks them and provides the median and the 25th and 75th percentiles.
Imágenes y archivos del mapa
Información
- Descripción
- Mapa Mental sobre Week4, creado por Tegan Rance el 19/10/2016.
- Creado por
- Tegan Rance
- Visitas
- 0
- Valoración