
Mapa mental
Measuring the User Experience (Tullis and Albert:2013)
Contenido del mapa
Measuring the User Experience (Tullis and Albert:2013)
4. Performance metrics
- Task success
- Binary success
- Levels of success
- Issues in measuring success
- Time on task
- Importance
- Collecting and measuring
- Analyzing and presenting
- Issues to consider
- Errors
- When to measure
- What is
- Collecting and measuring
- Analyzing and presenting
- Issues to consider
- Efficiency
- Collecting and measuring
- Analyzing and presenting
- As a combination of task success and time
- Learnability
- Collecting and measuring
- Analyzing and presenting
- Issues to consider
- Task success
5. Issue-based metrics
- What is an issue?
- Real vs. false
- How to identify
- In-person study
- Automated study
- Analyzing and reporting metrics for usability issues
- Freq of unique issues
- Freq of issues per participant
- Freq of participants
- Issues by category
- Issues by task
- Consistency and bias
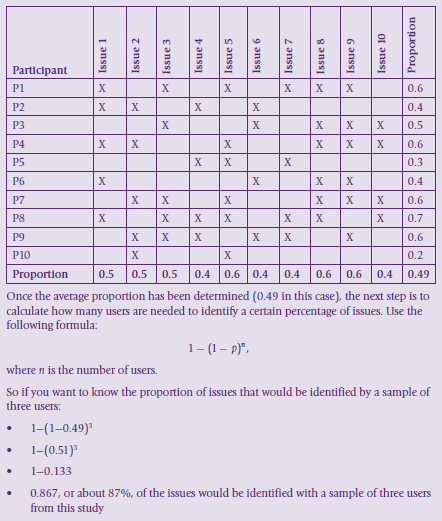
- Number of participants
- 83% of issues by 1st 5 people (31% avg prob of any one issue)
- Other study only 35% of issues
- Tullis: Catch big issues; Homogenous user group; Limited design
- More people when all issues must be caught; various user groups; Large design
- Tullis: Catch big issues; Homogenous user group; Limited design
- Other study only 35% of issues
- 83% of issues by 1st 5 people (31% avg prob of any one issue)
- Severity ratings
- Based on UX
- Based on combination of factors
- Using rating system
- Caveats
- What is an issue?
6. Self-reported metrics
- Importance: User perception; Insight into feelings
- Rating scales
- Likert
- Semantic differential scales
- How and when:
- Analyzing
- Post-task rating
- Ease of use
- After-Scenario Questionnaire (ASQ)
- Expectation measure
- Post-session ratings
- Aggregating individual task ratings
- System Usability Scale
- Computer System Usability Questionnaire
- Questionnaire for UI satisfaction
- Usefulness, Satisfaction, and Ease-of-Use Questionnaire (USE)
- Product reaction cards
- Other types
- Specific attributes
- Specific elements
- Open-ended questions
- Awareness and comprehension
- Awareness and usefulness gaps
7. Behavioural and Physiological Metrics
- Unprompted verbal expressions
- Eye tracking
- Scan path
- Heat map
- Areas of Interest (AOIs)
- Binning chart
- Metrics
- Dwell time
- # of fixations
- Fixation duration
- Sequence
- Time to First Fixation
- Revisits
- Hit ratio
- Revisits
- Time to First Fixation
- Sequence
- Fixation duration
- # of fixations
- Dwell time
- Analysis
- Pupillary response
- Emotion
- Affectiva; Q-Sensor; Blue Bubble Lab; Emovision; Seren; Emotiv
- Stress and physiological measures
- Heart rate variance
- Skin conductance
- PressureMouse; Posture Analysis Seat
8. Combined and comparative metrics
- Single Usability Scores
- Based on target goals
- Based on Percentages
- Based on Z scores
- Using single usability metric
- Usability scorecards
- Comparisons against
- Goals
- Expert performance
- Single Usability Scores
The basics
- 1. Introduction
- Definitions
- UX: User involved, interact with interface, measurable and interesting
- Value of UX metrics
- Structure, extent, evaluation of changes, ROI, patterms
- Ten myths
- 1. Take too much time 2. Too expensive 3. Not useful for small improvements 4. Don't help understand causes 5. Too noisy 6. Trust your gut 7. Don't apply to new products 8. No metrics exist for this 9. Management doesn't care 10. Can't collect data with small sample
- 1. Take too much time
- 2. Too expensive
- 3. Not useful for small improvements
- 4. Don't help understand causes
- 5. Too noisy
- 6. Trust your gut
- 7. Don't apply to new products
- 8. No metrics exist for this
- 9. Management doesn't care
- 10. Can't collect data with small sample
- 9. Management doesn't care
- 8. No metrics exist for this
- 7. Don't apply to new products
- 6. Trust your gut
- 5. Too noisy
- 4. Don't help understand causes
- 3. Not useful for small improvements
- 2. Too expensive
- Definitions
- 2. Background / Statistics
- Independent and dependent variables
- Dependent: Things you measure (e.g. # of errors)
- Independent: Things you control (e.g. Age, designs)
- Types of data
- Nominal
- Ordinal
- Interval
- Ratio
- Descriptive statistics
- Central tendency
- Variability
- Confidence intervals
- Comparing means
- Independent samples
- Paired samples
- >2 samples
- Relationships between variables
- Correlations
- Nonparametrics tests
- Chi square (X2)
- Graphical presentation
- Column or bar chart
- Line graphs
- Scatterplots
- Pie or donut chart
- Stacked bar or column
- Pie or donut chart
- Scatterplots
- Line graphs
- Column or bar chart
- Independent and dependent variables
- 3. Planning
- Study goals
- Formative study
- Summative study
- User goals
- Performance
- Satisfaction
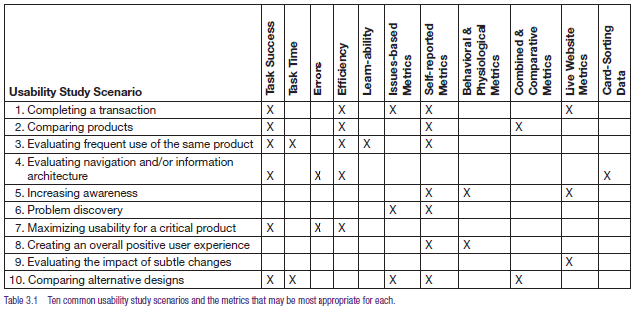
- Choosing the right metrics
- TEN TYPES OF USABILITY STUDIES
- Evaluation methods
- Traditional
- Online
- Online surveys
- Other study details
- Budget and timeline
- Partcipants
- Data collection
- Data cleanup
- Study goals
- 1. Introduction
Imágenes y archivos del mapa
Información
- Descripción
- Albert, W. and Tullis, T., 2013. Measuring the user experience: collecting, analyzing, and presenting usability metrics. Elsevier.
- Creado por
- William Dunn
- Visitas
- 207
- Etiquetas
- Valoración