
Mapa mental
Energy Level Diagrams
Contenido del mapa
Energy Level Diagrams
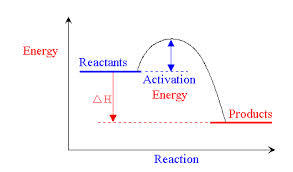
Exothermic Reactions
- The diagram shows the initial activation energy (energy needed to break initial bonds) and then the negative enthalpy change
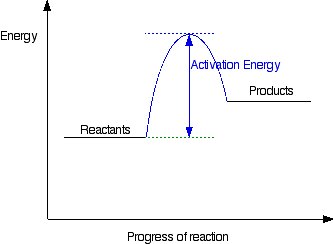
Endothermic Reactions
- This diagram shows the positive enthalpy change of an endothermic reaction. The energy released from forming new bonds is subtracted from the activation energy to give the final amount.
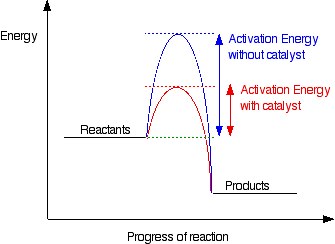
Activation Energy can be lowered with catalysts
- They provide a lower energy pathway to breaking initial bonds
- This is represented by the lower red curve on the diagram
- They provide a lower energy pathway to breaking initial bonds
Imágenes y archivos del mapa
Información
- Descripción
- Mapa Mental sobre Energy Level Diagrams, creado por WAVYPICK$ el 16/12/2014.
- Creado por
- WAVYPICK$
- Visitas
- 49
- Valoración