
Mapa mental
Statistics Exam 2
Contenido del mapa
Statistics Exam 2
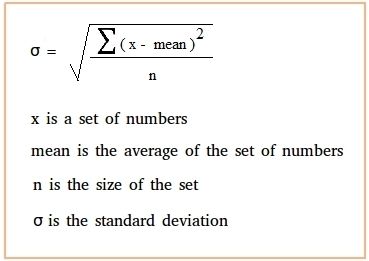
Standard Deviation (s)
Empirical Rule - If a data set is normally distributed then...
- 1) Approx. 68% of the data will fall within one standard deviation of the mean
- 2) Approx. 95% of the data will fall within two standard deviations of the mean
- 3) Approx. 99% of the data will fall within three standard deviations of the mean
- ! Only wonks if graph is bell shaped!
Probability (P)- The proportion of times an event occurs of an experiment is repeated a "large" number of times
- Two rules of Probability
- 1) All probabilities have to be between 0 and 1. 0 means no chance and 1 means it has to happen
- 2) The sum of all the probabilities has to equal one. Ex. 50/50 chance = 100
- Sample space (S) - The set of all possible outcomes of an experiment
- How to calculate probabilities:
- 1) List all events in the sample space (S)
- 2) Assign an appropriate probability to each event
- 3) Determine which events result in the event of interest
- 4) Add the probabilities up from step number 3
- Random Variable - Numeral description of the outcome of an experiment
- Probability Distribution - A formula, table, or graph that gives the probability associated with each value of the random variable
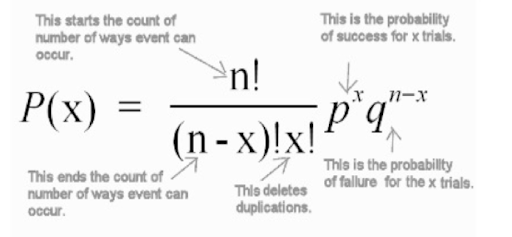
- The power will equal the total number of questions
- This is the binomial probability formula
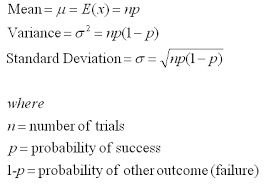
- mean and standard deviation for binomials
- Two rules of Probability
Imágenes y archivos del mapa
Información
- Descripción
- Formulas and information for Statistics Exam 2
- Creado por
- Hannah Brames
- Visitas
- 1
- Valoración