
Mapa mental
Linear Graphs & Coordinate Geometry
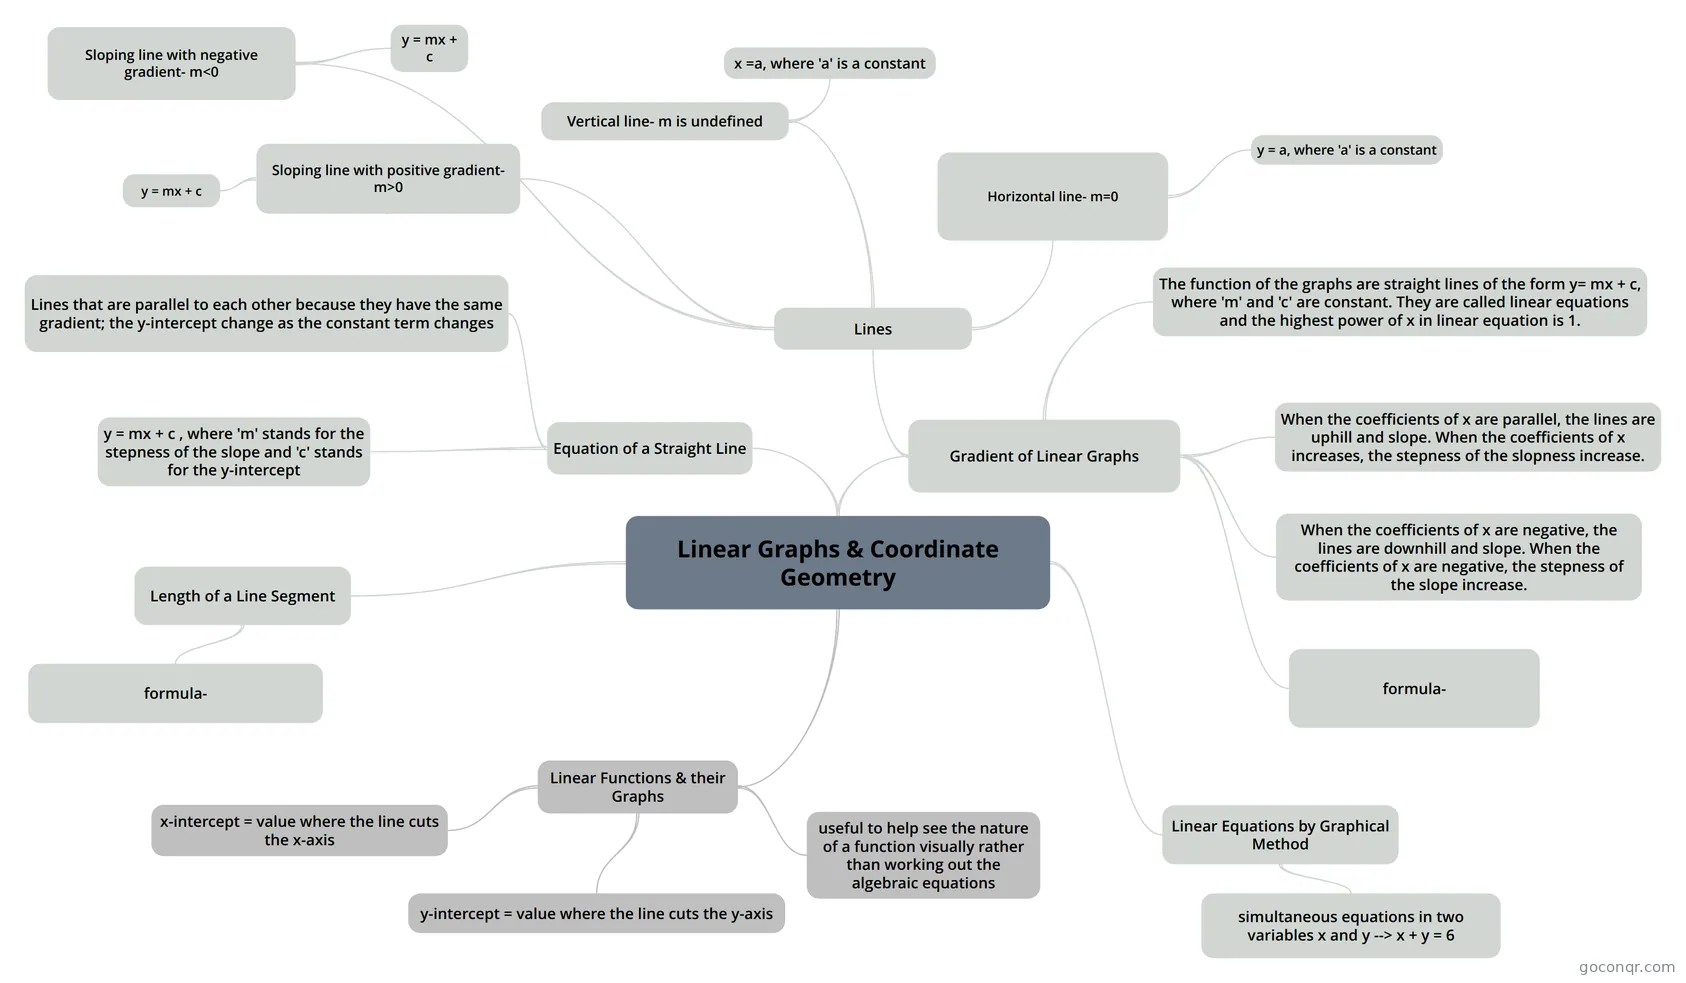
Mind map: Linear graphs and coordinate geometry
Contenido del mapa
Linear Graphs & Coordinate Geometry
Linear Functions & their Graphs
- useful to help see the nature of a function visually rather than working out the algebraic equations
- x-intercept = value where the line cuts the x-axis
- y-intercept = value where the line cuts the y-axis
Linear Equations by Graphical Method
- simultaneous equations in two variables x and y --> x + y = 6
Length of a Line Segment
- formula-
Gradient of Linear Graphs
- Lines
- Horizontal line- m=0
- y = a, where 'a' is a constant
- Vertical line- m is undefined
- x =a, where 'a' is a constant
- Sloping line with positive gradient- m>0
- y = mx + c
- Sloping line with negative gradient- m<0
- y = mx + c
- Horizontal line- m=0
- formula-
- The function of the graphs are straight lines of the form y= mx + c, where 'm' and 'c' are constant. They are called linear equations and the highest power of x in linear equation is 1.
- When the coefficients of x are parallel, the lines are uphill and slope. When the coefficients of x increases, the stepness of the slopness increase.
- When the coefficients of x are negative, the lines are downhill and slope. When the coefficients of x are negative, the stepness of the slope increase.
- Lines
Equation of a Straight Line
- y = mx + c , where 'm' stands for the stepness of the slope and 'c' stands for the y-intercept
- Lines that are parallel to each other because they have the same gradient; the y-intercept change as the constant term changes
Información
- Descripción
- Mapa Mental sobre Linear Graphs & Coordinate Geometry, creado por nhbn2001 el 28/06/2015.
- Creado por
- nhbn2001
- Visitas
- 6
- Valoración