
Mapa mental
Bivariate regression measures and correlation
Contenido del mapa
Bivariate regression measures and correlation
statistics bivariate
- Bivariate statistical techniques allow analysis set of two characteristics of the individuals of a population in order to detect possible relationships Between her. Nature
- Both variables quantitative
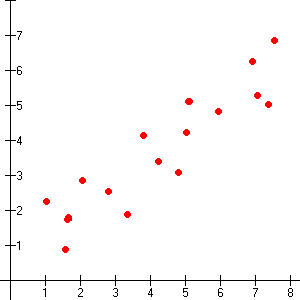
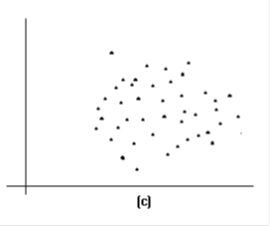
- Diagram of dispersion
- They are used to find out the intensity relationship between two variables numerical,
- coefficient of linear correlation of pearson
- The percentage of variability of Y explained by the variability in X is measured by the coefficient of determination that corresponds to r2.
- inferential
- Ha: variables are not independent (related variables)..
- Ho: the variables are independent (variables not related).
- Diagram of dispersion
- Both variables quantitative
- Bivariate data come from simultaneous observation of two variables (X, Y) in a sample of n individuals. In the studies of relationships between variables
- Bivariate statistical techniques allow analysis set of two characteristics of the individuals of a population in order to detect possible relationships Between her. Nature
Regression
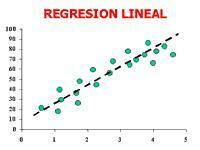
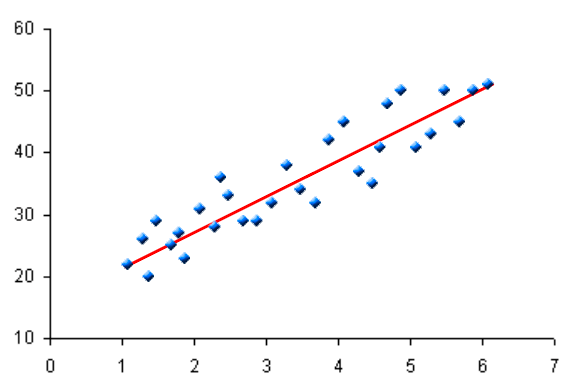
- The word regression is used to mean the estimation of a variable depending on another value known, corresponding to the other variable. it is said that the best line that fits a set
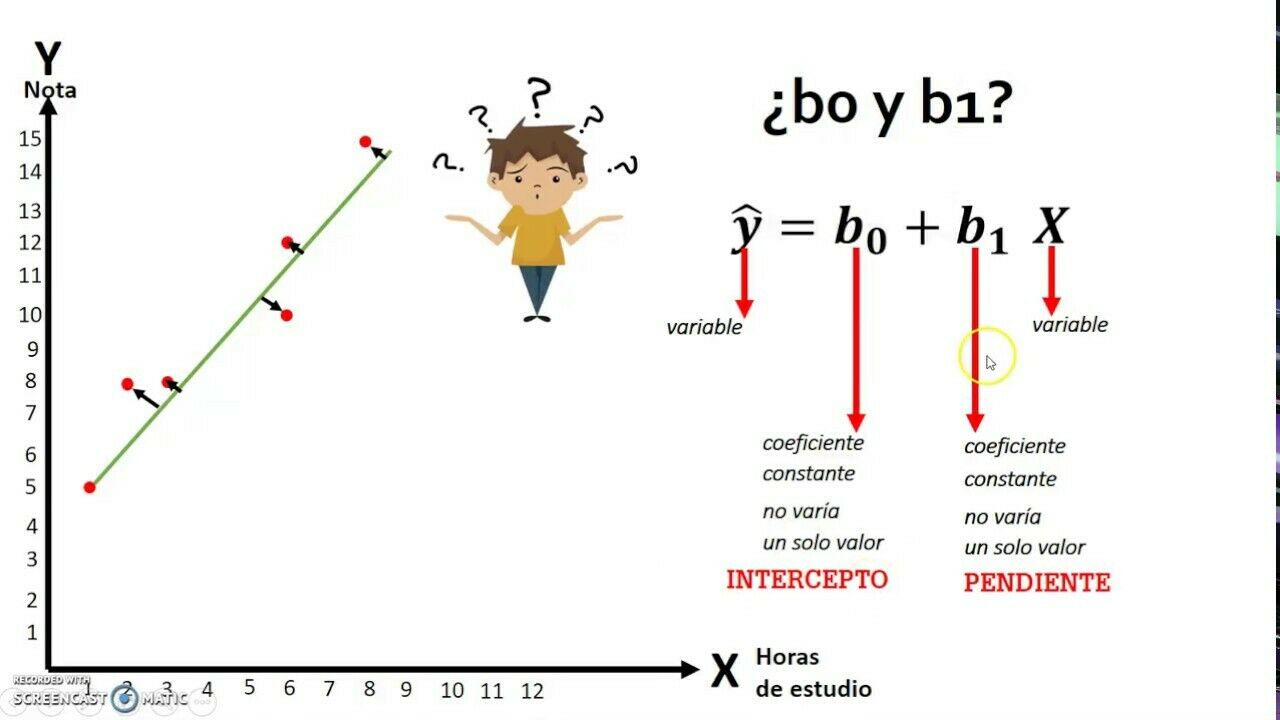
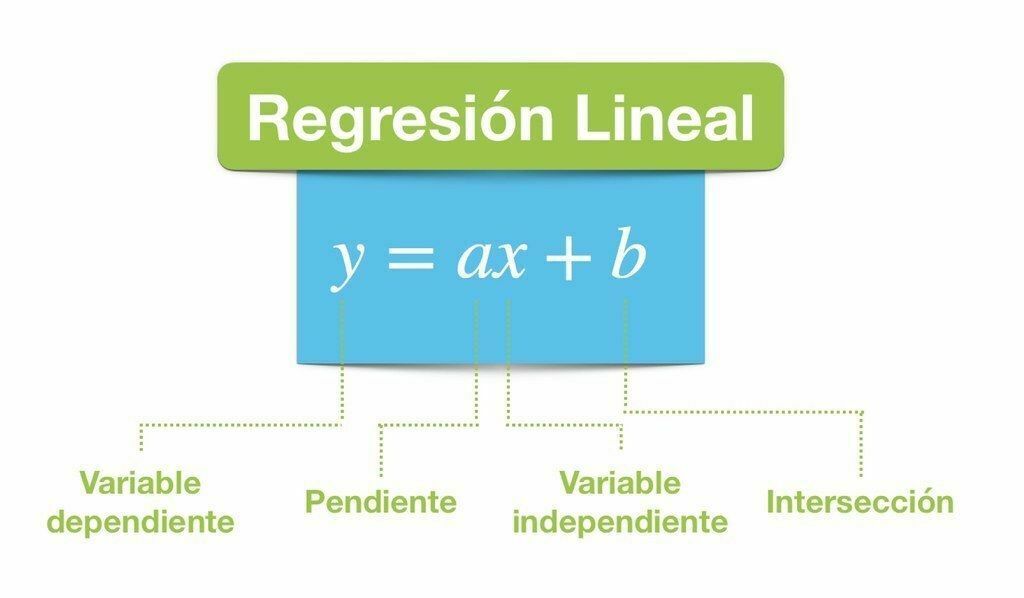
- The regression analysis leads to a mathematical equation that allows us describe the relationship between two variables, that is, get a line "ideal" known as the regression line,
- Linear regression simple
- Simple linear regression is the most widely used technique, it is a form that allows modeling a relationship between two sets of variables.
- Linear regression multiple
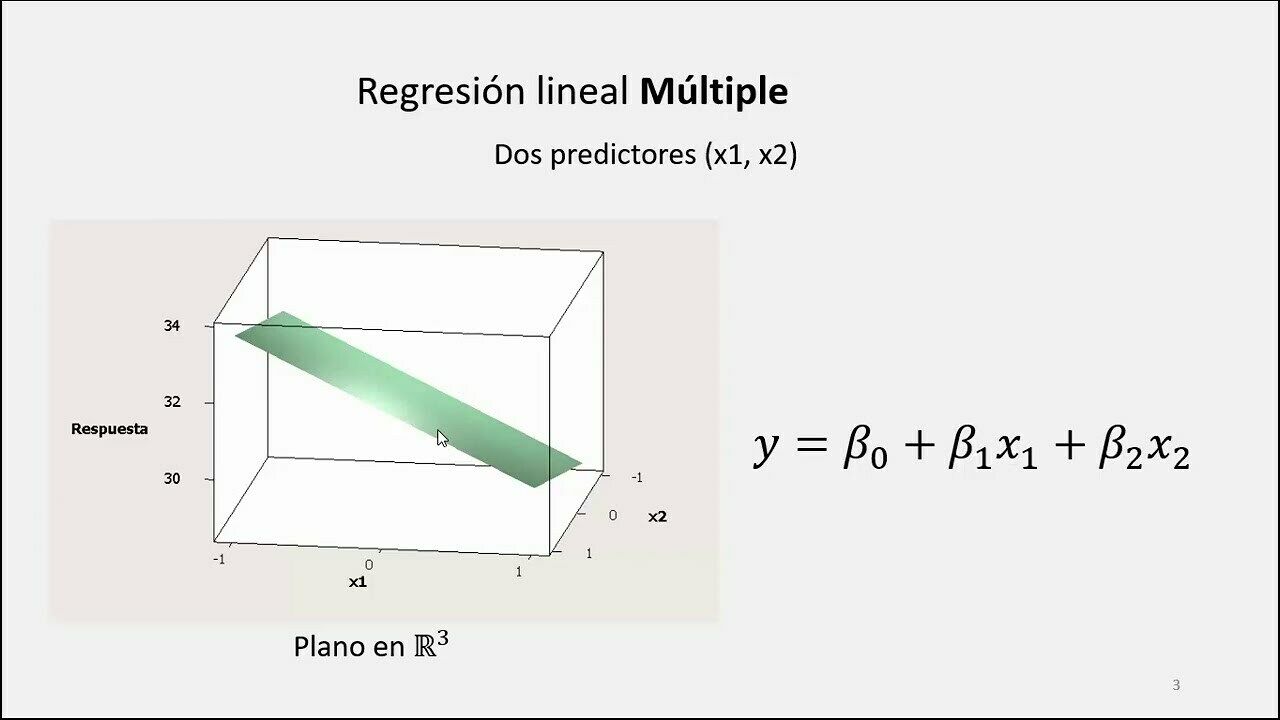
- Multiple linear regression is a statistical technique that is in charge of analyzing situations that involve more than one variable.
- The regression is aimed at describing how It is the relationship between two variables: X and Y.
- Multiple linear regression is a statistical technique that is in charge of analyzing situations that involve more than one variable.
- Linear regression simple
- It is a statistical technique that allows the change of one of the variables called response and that correspond to another known as an explanatory variable.
Correlation
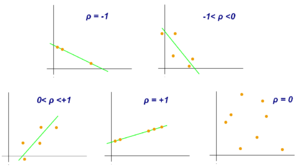
- The purpose of the correlation is to examine the direction and strength of the association between two quantitative variables. Thus the intensity of the relationship between them and if, at increase
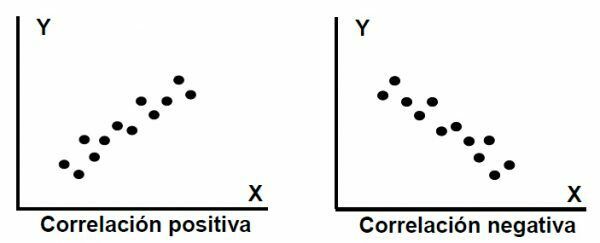
- positive correlation
- It is said that there is a positive linear correlation between two variables, if by increasing or decreasing the values of the independent variable increase or those of the independent variable decrease
- Negative correlation
- When by increasing the values of the variable independently decrease the values of the dependent variable, or vice versa, it is said that the linear correlation is negative. in this case the point cloud
- positive correlation
- Indicates the strength and direction of a linear relationship and proportionality between two statistical variables. Is considered that two quantitative variables
- The correlation between two variables seeks the determination and degree of relationship that exists between them. HE calculate with the coefficients of correlation. these are numbers that vary between +1 and -1
- The purpose of the correlation is to examine the direction and strength of the association between two quantitative variables. Thus the intensity of the relationship between them and if, at increase
Imágenes y archivos del mapa
Información
- Descripción
- Mapa Mental sobre Bivariate regression measures and correlation, creado por diana patricia torres rivera el 25/04/2022.
- Creado por
- diana patricia torres rivera
- Visitas
- 8
- Valoración