
Mapa mental
Position measures

Contenido del mapa
Position measures
Measures of non-central tendency are those values whose collection provides us with an indicator of the percentage of data that are on one side or the other of that value.
- They are part of the Non-Central Trend Measures
- quartiles
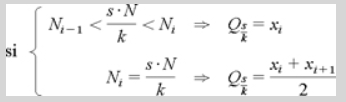
- Quartiles (k=4) are three values (Cs,s= 1,2,3) of the path that divide the distribution into 4 parts, each containing 25% (Garcia, J.E,2005, p, 39).
- deciles
- Deciles (k=10): are nine values of the path (Ds, s = 1.2......9) that divides the distribution into parts, so that each of them will contain 10% of the observations (Garcia, J.E,2005, p, 39).
- percentile
- percentiles: (K:100): ninety-nine values of the path (Ps, s=1,2,....99) that divides the distribution into 100 parts, each containing 1% of the observations (Garcia,J.2005,p.35). (Garcia,J.2005,p.35).
- quartiles
- Advantages and disadvantages
- Advantages provide information about the data series we are analyzing. The frequency distribution is located. It is easy to obtain.
- Disadvantages it is sensitive to extreme values. The influence of small values.
- characteristics
- Non-central position measures are the quantiles. These perform a series of equal divisions in the ordered distribution of the data. In this way, they reflect the upper, middle or lower values.
- They are part of the Non-Central Trend Measures
are classified as
- a. Measures of central tendency: arithmetic mean, harmonic mean, geometric mean, median, and mode. B. Measures of non-central tendency: Quantiles.
definition
- The position measures indicate a value of the variable around which a group of observations are placed.
The measures of central tendency allow us to summarize the set of data in one value, allowing us to describe it in an abbreviated and understandable way.
- It is part of the measures of the central tendencies
- arithmetic average
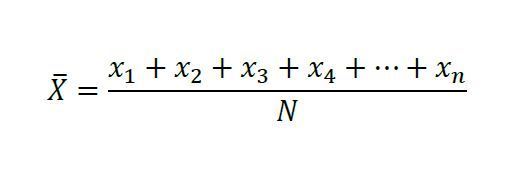
- In the sum of all the values of the variable divided by the total number of observations, this measure can only be calculated if the statistical variable under study is quantitative in nature (Garcia, J E. 2005 Pag,25).
- Properties; the sum of the deviations of the values of the variable from its arithmetic mean is zero.
- Geometric mean is used for averaging
- In the sum of all the values of the variable divided by the total number of observations, this measure can only be calculated if the statistical variable under study is quantitative in nature (Garcia, J E. 2005 Pag,25).
- Geometric average
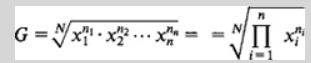
- The geometric mean of a frequency distribution (Xi;Ni), which is represented by G, is defined as the root N above the product of the values of the variable raised to their corresponding absolute frequencies. (M,2007,Pg. 23)
- Fashion
- It is the one denoted by Mo, it represents the value of the variable with the highest frequency. It does not have to be unique. That is to say, if there are two or more values of the variable that have the same frequency, this being the highest, it will be a multimodal distribution (biomodal) two modes; trimodal, three modes (Garcia J. E. 2005, p. 31).
- The amplitude of the intervals is the same
- The frequency interval is the one with the highest absolute frequency, as the values included in this interval are unknown, the mode can be approximated following criteria.
- La amplitud de los intervalos es distinta
- The amplitude of the intervals is the same
- It is the one denoted by Mo, it represents the value of the variable with the highest frequency. It does not have to be unique. That is to say, if there are two or more values of the variable that have the same frequency, this being the highest, it will be a multimodal distribution (biomodal) two modes; trimodal, three modes (Garcia J. E. 2005, p. 31).
- median
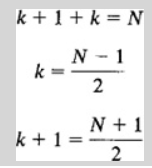
- ordered the frequency distribution from smallest to largest, the measure, denoted by Me, is a value of the variable's path that leaves the same number of observations to its left and to its right (Garcia, J. E,2035, pag, 31).iones a su izquierda y a su derecha. (Garcia, J. E,2035, pag, 31).
- The modal interval is not the one with the highest absolute frequency but the one with the highest frequency per unit interval, i.e., the highest frequency density.
- ordered the frequency distribution from smallest to largest, the measure, denoted by Me, is a value of the variable's path that leaves the same number of observations to its left and to its right (Garcia, J. E,2035, pag, 31).iones a su izquierda y a su derecha. (Garcia, J. E,2035, pag, 31).
- harmonic mean
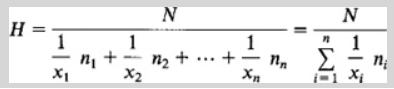
- the harmonic mean H of a frequency distribution (Xi;ni) is defined as the inverse of the arithmetic mean of the inverses of the values of the variable, this is the same as the two previous means, the harmonic mean has the advantage that in its calculation all the values of the variable are involved (Montero, J, M 2007. p,26).
- The harmonic mean is usually used to average yields, productivities, etc.; that is, when the units of measurement of the analyzed variable are given in the form of a quotient.
- EST, JOSE SALINAS
- the harmonic mean H of a frequency distribution (Xi;ni) is defined as the inverse of the arithmetic mean of the inverses of the values of the variable, this is the same as the two previous means, the harmonic mean has the advantage that in its calculation all the values of the variable are involved (Montero, J, M 2007. p,26).
- arithmetic average
- It is part of the measures of the central tendencies
Imágenes y archivos del mapa



Información
- Descripción
- Mapa Mental sobre Position measures, creado por JOSE SALINAS el 20/10/2022.
- Creado por
- JOSE SALINAS
- Visitas
- 1
- Valoración