
Mapa mental
Population
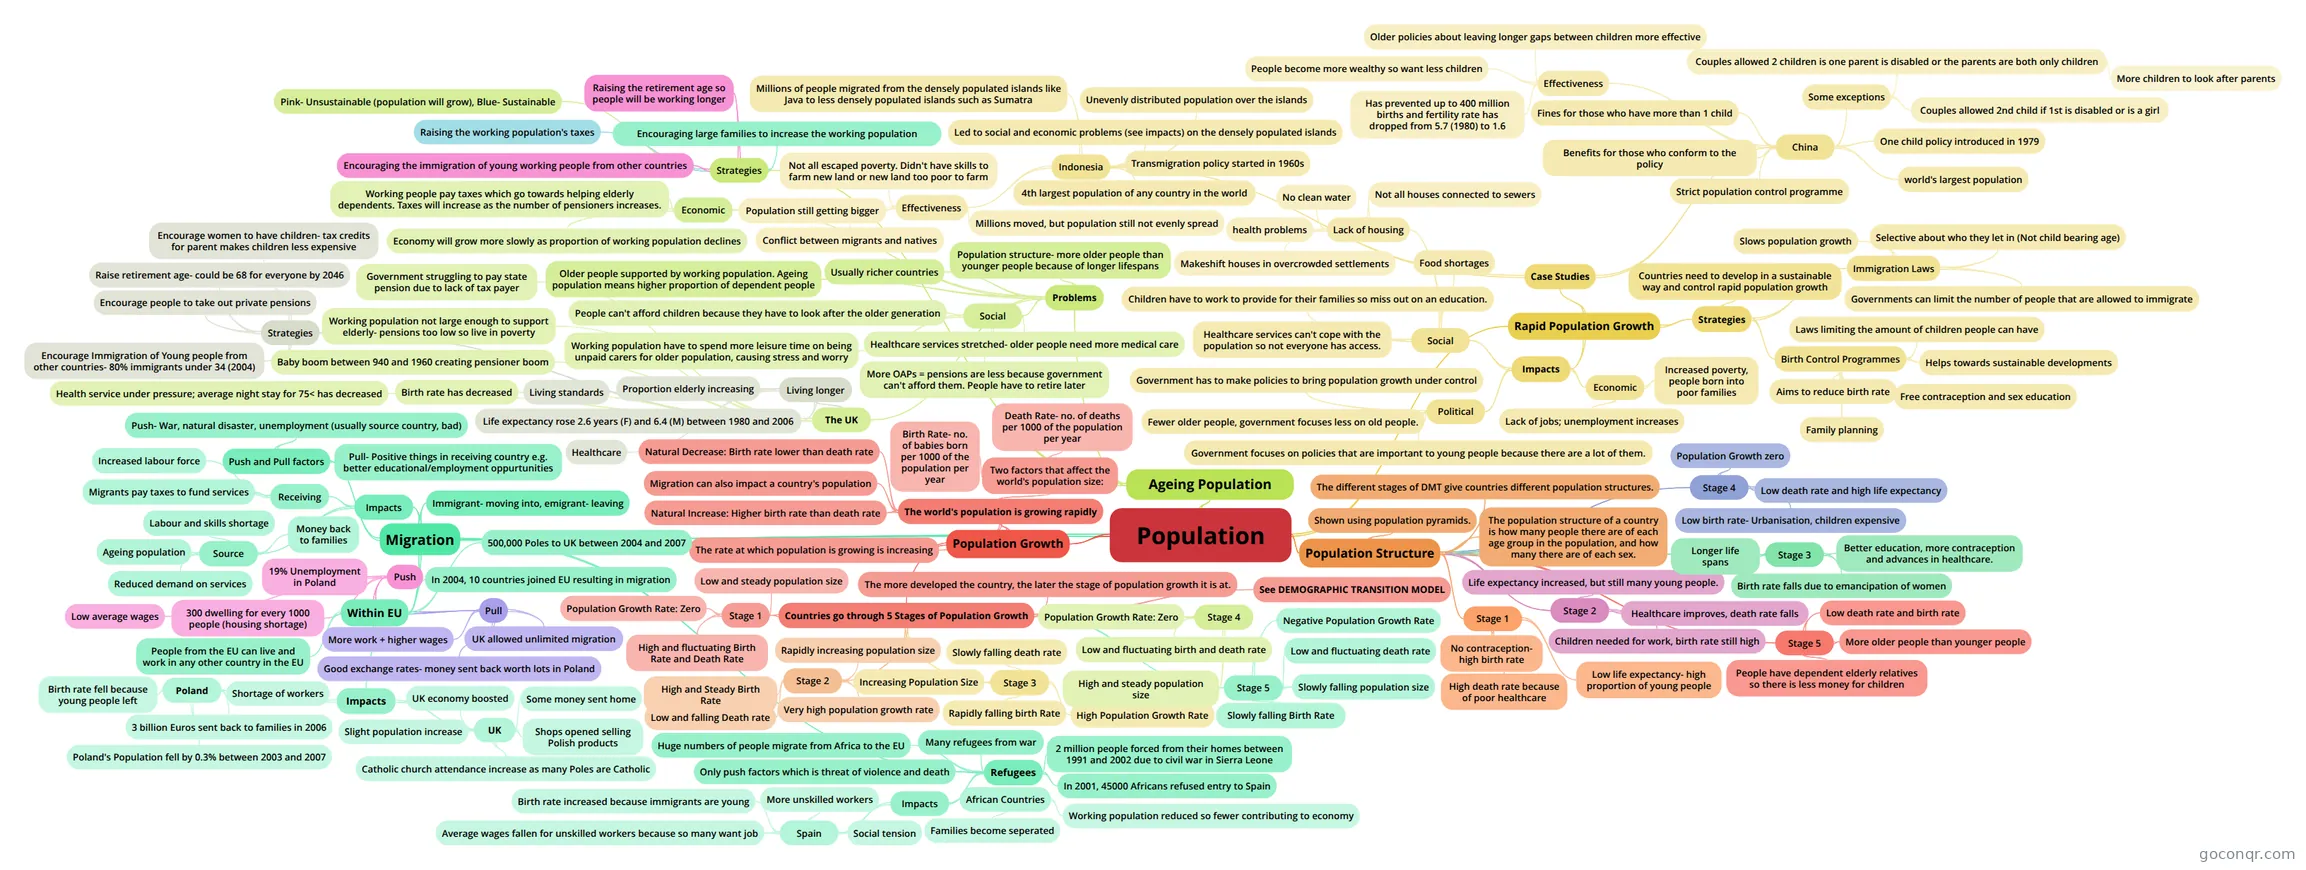
Mind map: Population geography
Contenido del mapa
Population
Population Growth
- The world's population is growing rapidly
- The rate at which population is growing is increasing
- Two factors that affect the world's population size:
- Birth Rate- no. of babies born per 1000 of the population per year
- Death Rate- no. of deaths per 1000 of the population per year
- Natural Increase: Higher birth rate than death rate
- Natural Decrease: Birth rate lower than death rate
- Migration can also impact a country's population
- Countries go through 5 Stages of Population Growth
- The more developed the country, the later the stage of population growth it is at.
- Stage 1
- High and fluctuating Birth Rate and Death Rate
- Low and steady population size
- Population Growth Rate: Zero
- Stage 2
- High and Steady Birth Rate
- Low and falling Death rate
- Very high population growth rate
- Rapidly increasing population size
- Stage 3
- Rapidly falling birth Rate
- Slowly falling death rate
- High Population Growth Rate
- Increasing Population Size
- Stage 4
- Population Growth Rate: Zero
- Low and fluctuating birth and death rate
- High and steady population size
- Stage 5
- Slowly falling Birth Rate
- Slowly falling population size
- Low and fluctuating death rate
- Negative Population Growth Rate
- See DEMOGRAPHIC TRANSITION MODEL
- The world's population is growing rapidly
Population Structure
- The population structure of a country is how many people there are of each age group in the population, and how many there are of each sex.
- Shown using population pyramids.
- The different stages of DMT give countries different population structures.
- Stage 1
- No contraception- high birth rate
- High death rate because of poor healthcare
- Low life expectancy- high proportion of young people
- Stage 2
- Healthcare improves, death rate falls
- Children needed for work, birth rate still high
- Life expectancy increased, but still many young people.
- Stage 3
- Birth rate falls due to emancipation of women
- Better education, more contraception and advances in healthcare.
- Longer life spans
- Stage 4
- Low birth rate- Urbanisation, children expensive
- Low death rate and high life expectancy
- Population Growth zero
- Stage 5
- People have dependent elderly relatives so there is less money for children
- More older people than younger people
- Low death rate and birth rate
Rapid Population Growth
- Impacts
- Economic
- Lack of jobs; unemployment increases
- Increased poverty, people born into poor families
- Social
- Healthcare services can't cope with the population so not everyone has access.
- Children have to work to provide for their families so miss out on an education.
- Food shortages
- Lack of housing
- Makeshift houses in overcrowded settlements
- health problems
- No clean water
- Not all houses connected to sewers
- Political
- Government focuses on policies that are important to young people because there are a lot of them.
- Fewer older people, government focuses less on old people.
- Government has to make policies to bring population growth under control
- Economic
- Strategies
- Countries need to develop in a sustainable way and control rapid population growth
- Birth Control Programmes
- Aims to reduce birth rate
- Laws limiting the amount of children people can have
- Free contraception and sex education
- Family planning
- Helps towards sustainable developments
- Immigration Laws
- Governments can limit the number of people that are allowed to immigrate
- Selective about who they let in (Not child bearing age)
- Slows population growth
- Case Studies
- China
- Strict population control programme
- world's largest population
- One child policy introduced in 1979
- Benefits for those who conform to the policy
- Fines for those who have more than 1 child
- Some exceptions
- Couples allowed 2nd child if 1st is disabled or is a girl
- Couples allowed 2 children is one parent is disabled or the parents are both only children
- More children to look after parents
- Effectiveness
- Has prevented up to 400 million births and fertility rate has dropped from 5.7 (1980) to 1.6
- Older policies about leaving longer gaps between children more effective
- People become more wealthy so want less children
- Indonesia
- 4th largest population of any country in the world
- Unevenly distributed population over the islands
- Led to social and economic problems (see impacts) on the densely populated islands
- Transmigration policy started in 1960s
- Millions of people migrated from the densely populated islands like Java to less densely populated islands such as Sumatra
- Effectiveness
- Millions moved, but population still not evenly spread
- Not all escaped poverty. Didn't have skills to farm new land or new land too poor to farm
- Conflict between migrants and natives
- Population still getting bigger
- China
- Impacts
Ageing Population
- Problems
- Population structure- more older people than younger people because of longer lifespans
- Usually richer countries
- Older people supported by working population. Ageing population means higher proportion of dependent people
- Social
- Healthcare services stretched- older people need more medical care
- Working population have to spend more leisure time on being unpaid carers for older population, causing stress and worry
- People can't afford children because they have to look after the older generation
- More OAPs = pensions are less because government can't afford them. People have to retire later
- Economic
- Working people pay taxes which go towards helping elderly dependents. Taxes will increase as the number of pensioners increases.
- Economy will grow more slowly as proportion of working population declines
- The UK
- Living longer
- Healthcare
- Living standards
- Life expectancy rose 2.6 years (F) and 6.4 (M) between 1980 and 2006
- Proportion elderly increasing
- Baby boom between 940 and 1960 creating pensioner boom
- Birth rate has decreased
- Working population not large enough to support elderly- pensions too low so live in poverty
- Government struggling to pay state pension due to lack of tax payer
- Health service under pressure; average night stay for 75< has decreased
- Strategies
- Raise retirement age- could be 68 for everyone by 2046
- Encourage Immigration of Young people from other countries- 80% immigrants under 34 (2004)
- Encourage women to have children- tax credits for parent makes children less expensive
- Encourage people to take out private pensions
- Living longer
- Strategies
- Encouraging large families to increase the working population
- Encouraging the immigration of young working people from other countries
- Raising the retirement age so people will be working longer
- Raising the working population's taxes
- Pink- Unsustainable (population will grow), Blue- Sustainable
- Problems
Migration
- Immigrant- moving into, emigrant- leaving
- Push and Pull factors
- Push- War, natural disaster, unemployment (usually source country, bad)
- Pull- Positive things in receiving country e.g. better educational/employment oppurtunities
- Impacts
- Source
- Reduced demand on services
- Money back to families
- Labour and skills shortage
- Ageing population
- Receiving
- Increased labour force
- Migrants pay taxes to fund services
- Source
- Within EU
- People from the EU can live and work in any other country in the EU
- In 2004, 10 countries joined EU resulting in migration
- 500,000 Poles to UK between 2004 and 2007
- Push
- 19% Unemployment in Poland
- Low average wages
- 300 dwelling for every 1000 people (housing shortage)
- Pull
- UK allowed unlimited migration
- More work + higher wages
- Good exchange rates- money sent back worth lots in Poland
- Impacts
- UK
- Slight population increase
- UK economy boosted
- Some money sent home
- Shops opened selling Polish products
- Catholic church attendance increase as many Poles are Catholic
- Poland
- Poland's Population fell by 0.3% between 2003 and 2007
- Birth rate fell because young people left
- 3 billion Euros sent back to families in 2006
- Shortage of workers
- UK
- Refugees
- Huge numbers of people migrate from Africa to the EU
- In 2001, 45000 Africans refused entry to Spain
- Many refugees from war
- 2 million people forced from their homes between 1991 and 2002 due to civil war in Sierra Leone
- Only push factors which is threat of violence and death
- Impacts
- Spain
- Social tension
- More unskilled workers
- Average wages fallen for unskilled workers because so many want job
- Birth rate increased because immigrants are young
- African Countries
- Working population reduced so fewer contributing to economy
- Families become seperated
- Spain
Información
- Descripción
- GCSE Geography Mapa Mental sobre Population, creado por Abby Whitmore el 18/02/2016.
- Creado por
- Abby Whitmore
- Visitas
- 142
- Etiquetas
- Valoración