
Mapa mental
Stem-And-Leaf Diagrams
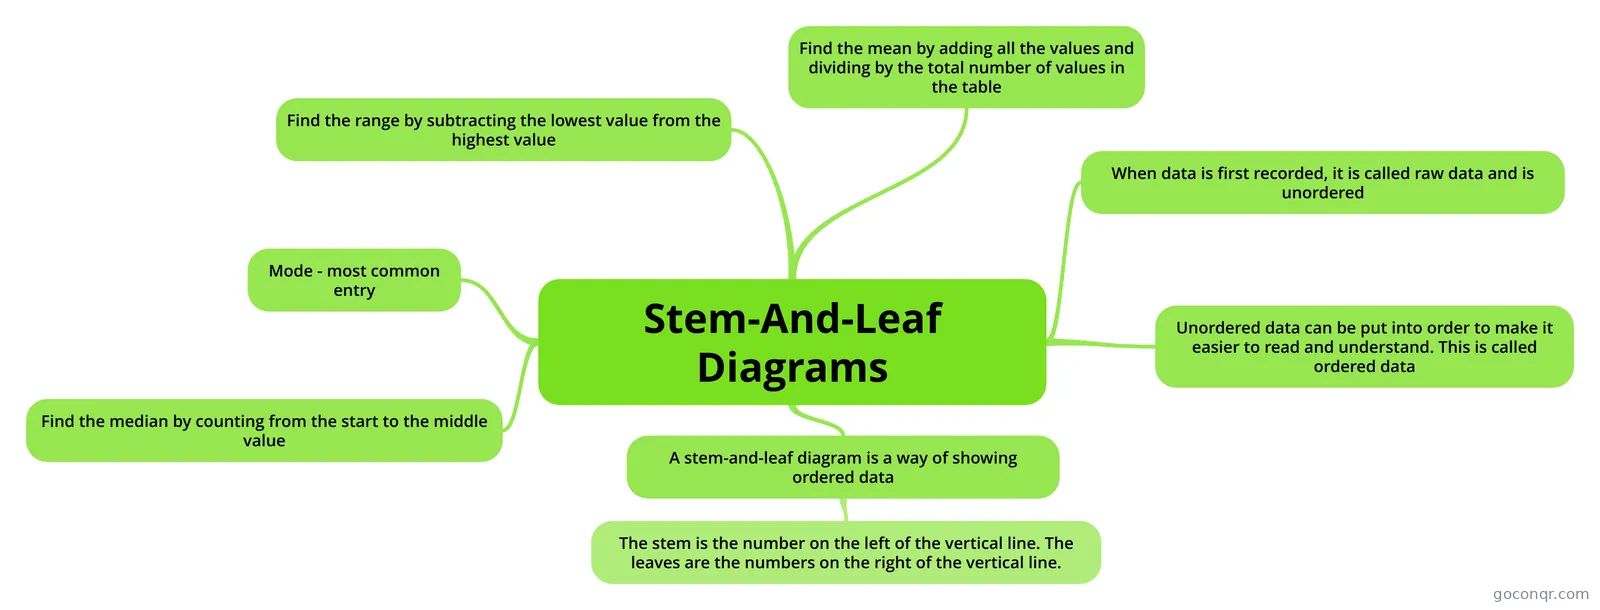
Mind map: stem-and-leaf diagrams
Contenido del mapa
Stem-And-Leaf Diagrams
When data is first recorded, it is called raw data and is unordered
Unordered data can be put into order to make it easier to read and understand. This is called ordered data
A stem-and-leaf diagram is a way of showing ordered data
- The stem is the number on the left of the vertical line. The leaves are the numbers on the right of the vertical line.
Mode - most common entry
Find the median by counting from the start to the middle value
Find the range by subtracting the lowest value from the highest value
Find the mean by adding all the values and dividing by the total number of values in the table
Información
- Descripción
- GCSE (Statistics) Maths Mapa Mental sobre Stem-And-Leaf Diagrams, creado por Olivia Brooklyn el 08/03/2014.
- Creado por
- Olivia Brooklyn
- Visitas
- 161
- Etiquetas
- Valoración