
Mapa mental
Cumulative Frequency Diagrams
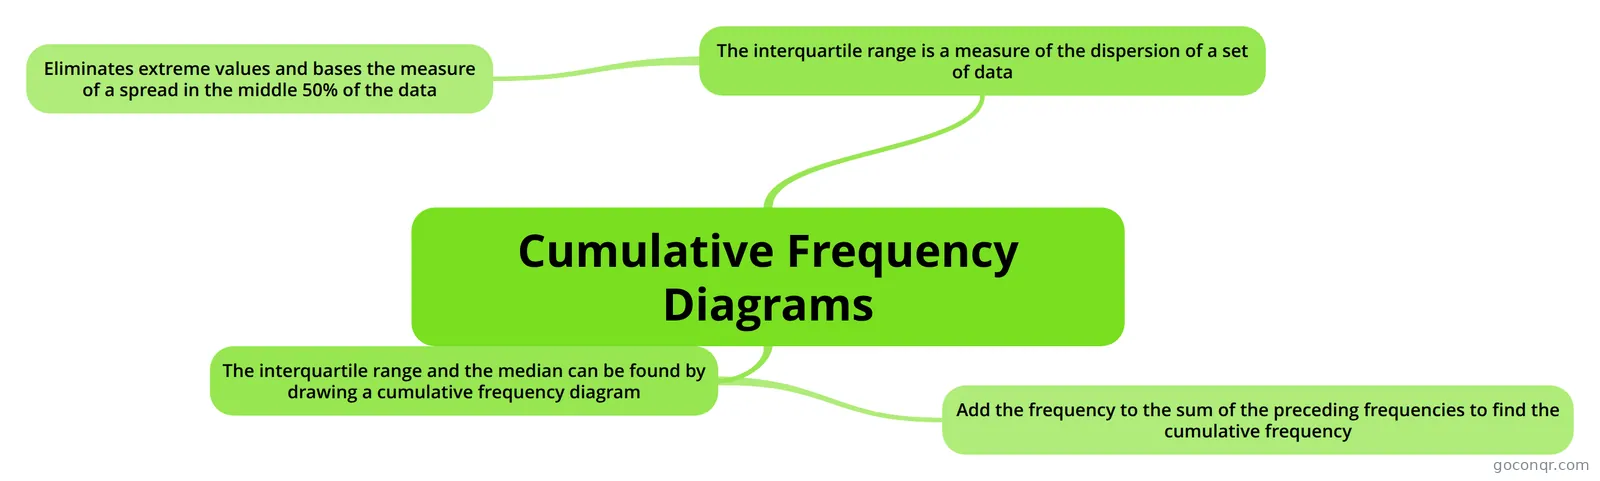
Mind map: cumulative frequency diagrams
Contenido del mapa
Cumulative Frequency Diagrams
The interquartile range is a measure of the dispersion of a set of data
- Eliminates extreme values and bases the measure of a spread in the middle 50% of the data
The interquartile range and the median can be found by drawing a cumulative frequency diagram
- Add the frequency to the sum of the preceding frequencies to find the cumulative frequency
Información
- Descripción
- GCSE (Statistics) Maths Mapa Mental sobre Cumulative Frequency Diagrams, creado por Olivia Brooklyn el 08/03/2014.
- Creado por
- Olivia Brooklyn
- Visitas
- 146
- Etiquetas
- Valoración