
Mapa mental
The Anthropocene
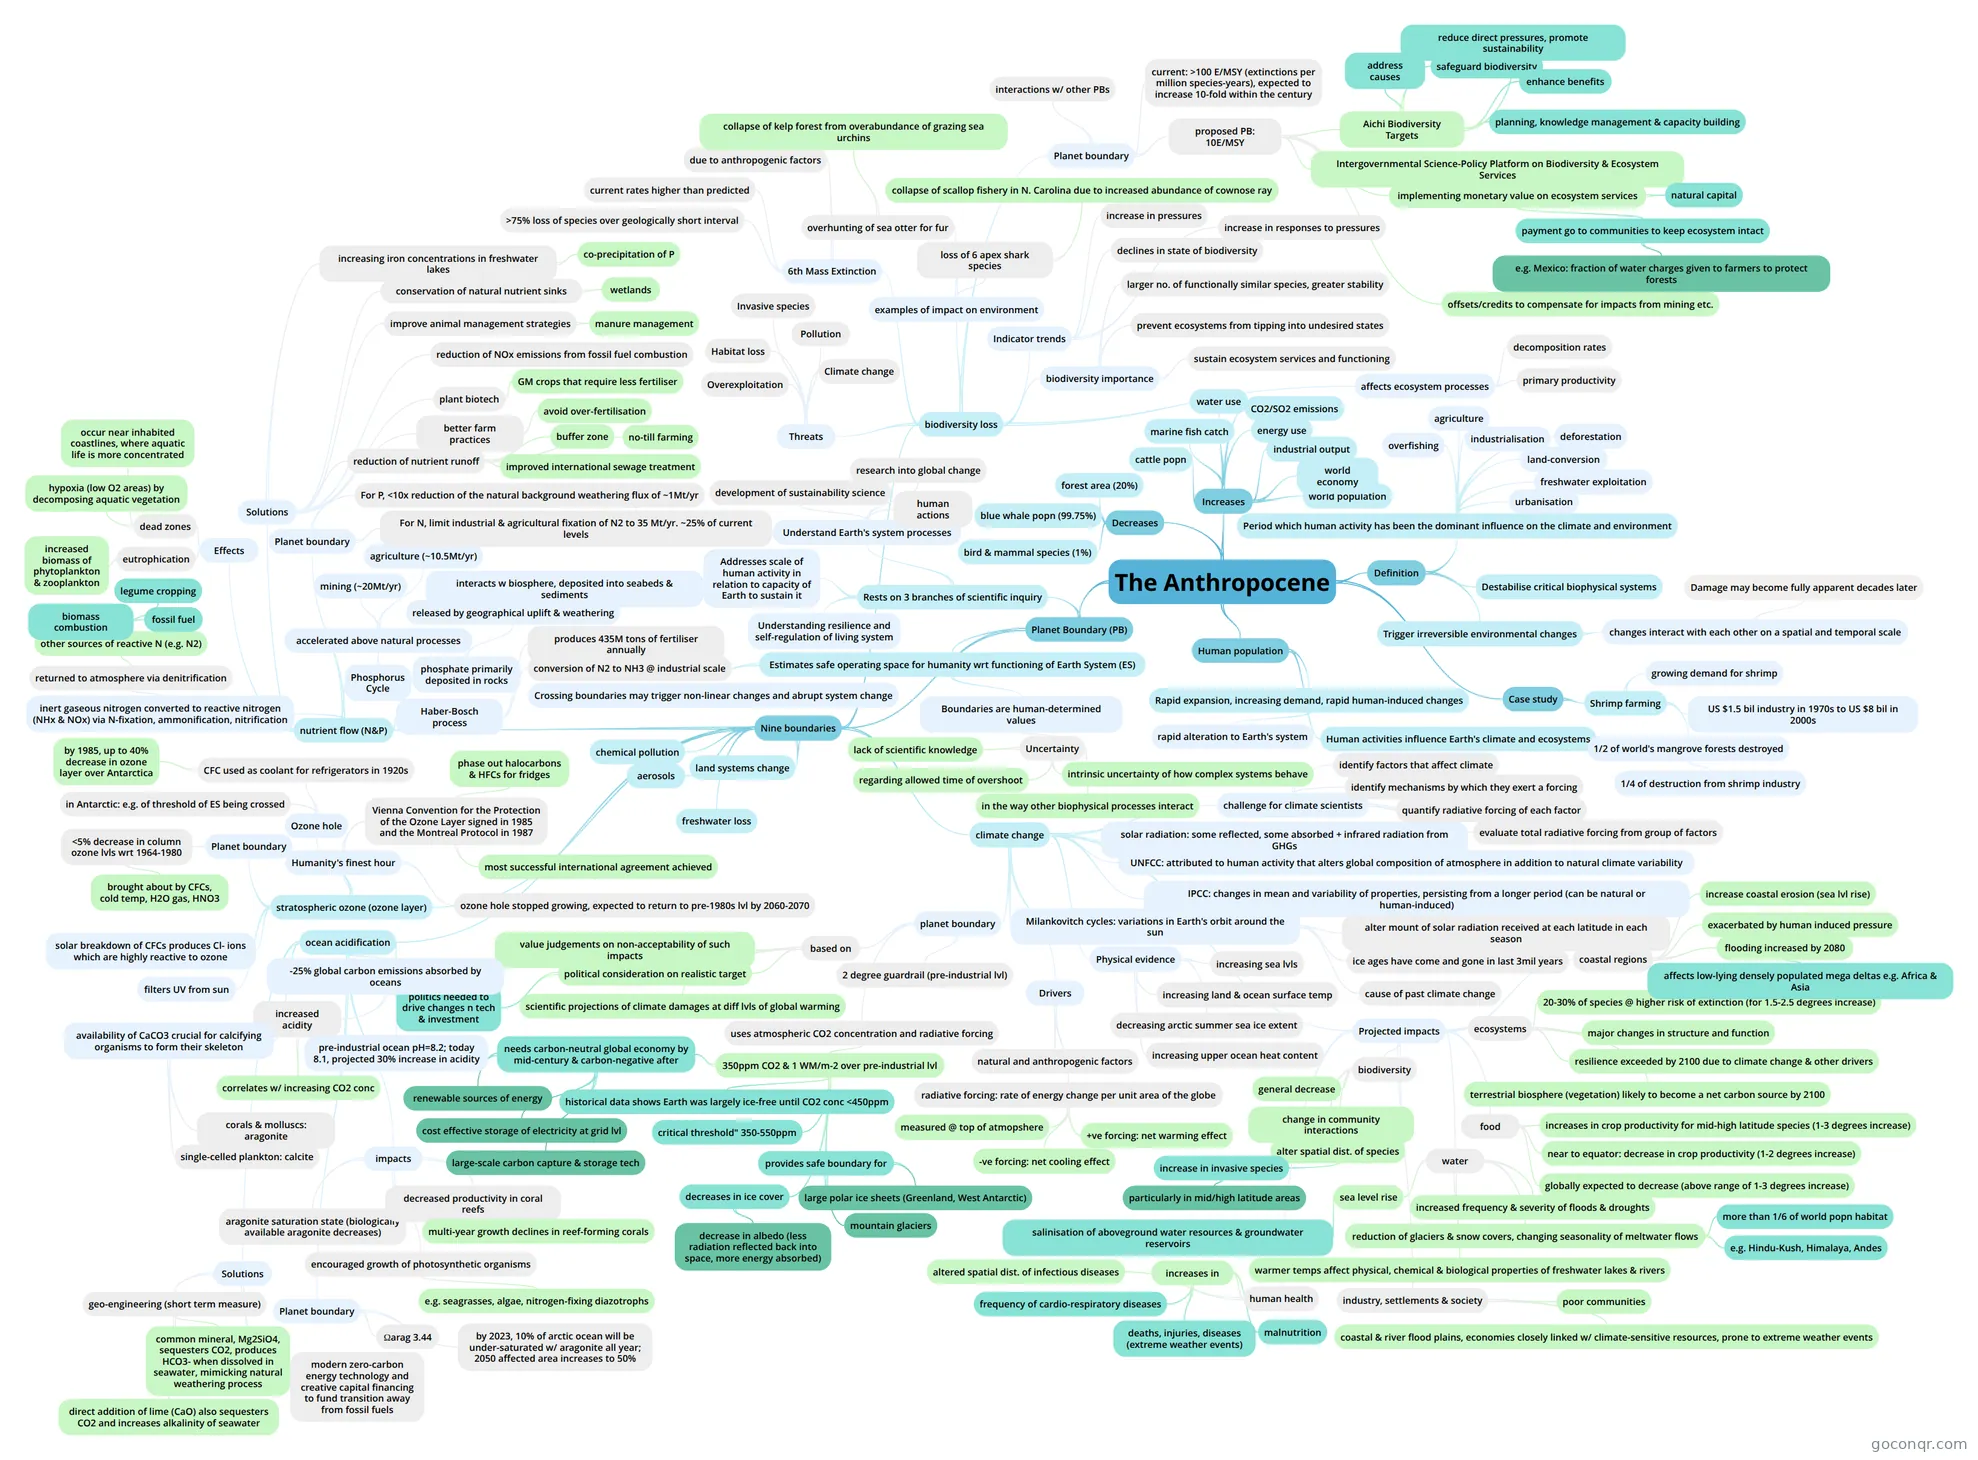
Mind map: The Anthropocene
Contenido del mapa
The Anthropocene
Human population
- Rapid expansion, increasing demand, rapid human-induced changes
- rapid alteration to Earth's system
- Human activities influence Earth's climate and ecosystems
- Rapid expansion, increasing demand, rapid human-induced changes
Definition
- Period which human activity has been the dominant influence on the climate and environment
- deforestation
- land-conversion
- freshwater exploitation
- industrialisation
- agriculture
- urbanisation
- overfishing
- Destabilise critical biophysical systems
- Trigger irreversible environmental changes
- changes interact with each other on a spatial and temporal scale
- Damage may become fully apparent decades later
- changes interact with each other on a spatial and temporal scale
- Period which human activity has been the dominant influence on the climate and environment
Increases
- world population
- world economy
- industrial output
- energy use
- CO2/SO2 emissions
- water use
- marine fish catch
- cattle popn
Decreases
- forest area (20%)
- blue whale popn (99.75%)
- bird & mammal species (1%)
Case study
- Shrimp farming
- growing demand for shrimp
- US $1.5 bil industry in 1970s to US $8 bil in 2000s
- 1/2 of world's mangrove forests destroyed
- 1/4 of destruction from shrimp industry
- Shrimp farming
Planet Boundary (PB)
- Estimates safe operating space for humanity wrt functioning of Earth System (ES)
- Boundaries are human-determined values
- Uncertainty
- lack of scientific knowledge
- intrinsic uncertainty of how complex systems behave
- in the way other biophysical processes interact
- regarding allowed time of overshoot
- Uncertainty
- Crossing boundaries may trigger non-linear changes and abrupt system change
- Boundaries are human-determined values
- Rests on 3 branches of scientific inquiry
- Addresses scale of human activity in relation to capacity of Earth to sustain it
- Understand Earth's system processes
- human actions
- research into global change
- development of sustainability science
- Understanding resilience and self-regulation of living system
- Nine boundaries
- climate change
- solar radiation: some reflected, some absorbed + infrared radiation from GHGs
- UNFCC: attributed to human activity that alters global composition of atmosphere in addition to natural climate variability
- IPCC: changes in mean and variability of properties, persisting from a longer period (can be natural or human-induced)
- Milankovitch cycles: variations in Earth's orbit around the sun
- alter mount of solar radiation received at each latitude in each season
- ice ages have come and gone in last 3mil years
- cause of past climate change
- Physical evidence
- increasing land & ocean surface temp
- decreasing arctic summer sea ice extent
- increasing upper ocean heat content
- increasing sea lvls
- Drivers
- natural and anthropogenic factors
- radiative forcing: rate of energy change per unit area of the globe
- measured @ top of atmopshere
- +ve forcing: net warming effect
- -ve forcing: net cooling effect
- planet boundary
- 2 degree guardrail (pre-industrial lvl)
- based on
- scientific projections of climate damages at diff lvls of global warming
- value judgements on non-acceptability of such impacts
- political consideration on realistic target
- politics needed to drive changes n tech & investment
- uses atmospheric CO2 concentration and radiative forcing
- 350ppm CO2 & 1 WM/m-2 over pre-industrial lvl
- historical data shows Earth was largely ice-free until CO2 conc <450ppm
- critical threshold" 350-550ppm
- provides safe boundary for
- large polar ice sheets (Greenland, West Antarctic)
- mountain glaciers
- decreases in ice cover
- decrease in albedo (less radiation reflected back into space, more energy absorbed)
- needs carbon-neutral global economy by mid-century & carbon-negative after
- renewable sources of energy
- cost effective storage of electricity at grid lvl
- large-scale carbon capture & storage tech
- 350ppm CO2 & 1 WM/m-2 over pre-industrial lvl
- Projected impacts
- ecosystems
- 20-30% of species @ higher risk of extinction (for 1.5-2.5 degrees increase)
- major changes in structure and function
- resilience exceeded by 2100 due to climate change & other drivers
- terrestrial biosphere (vegetation) likely to become a net carbon source by 2100
- food
- increases in crop productivity for mid-high latitude species (1-3 degrees increase)
- near to equator: decrease in crop productivity (1-2 degrees increase)
- globally expected to decrease (above range of 1-3 degrees increase)
- water
- increased frequency & severity of floods & droughts
- reduction of glaciers & snow covers, changing seasonality of meltwater flows
- more than 1/6 of world popn habitat
- e.g. Hindu-Kush, Himalaya, Andes
- warmer temps affect physical, chemical & biological properties of freshwater lakes & rivers
- sea level rise
- salinisation of aboveground water resources & groundwater reservoirs
- coastal regions
- increase coastal erosion (sea lvl rise)
- exacerbated by human induced pressure
- flooding increased by 2080
- affects low-lying densely populated mega deltas e.g. Africa & Asia
- industry, settlements & society
- coastal & river flood plains, economies closely linked w/ climate-sensitive resources, prone to extreme weather events
- poor communities
- human health
- increases in
- malnutrition
- deaths, injuries, diseases (extreme weather events)
- frequency of cardio-respiratory diseases
- altered spatial dist. of infectious diseases
- increases in
- biodiversity
- general decrease
- change in community interactions
- alter spatial dist. of species
- increase in invasive species
- particularly in mid/high latitude areas
- increase in invasive species
- ecosystems
- challenge for climate scientists
- identify factors that affect climate
- identify mechanisms by which they exert a forcing
- quantify radiative forcing of each factor
- evaluate total radiative forcing from group of factors
- ocean acidification
- -25% global carbon emissions absorbed by oceans
- increased acidity
- correlates w/ increasing CO2 conc
- increased acidity
- pre-industrial ocean pH=8.2; today 8.1, projected 30% increase in acidity
- availability of CaCO3 crucial for calcifying organisms to form their skeleton
- corals & molluscs: aragonite
- single-celled plankton: calcite
- impacts
- aragonite saturation state (biologically available aragonite decreases)
- decreased productivity in coral reefs
- multi-year growth declines in reef-forming corals
- encouraged growth of photosynthetic organisms
- e.g. seagrasses, algae, nitrogen-fixing diazotrophs
- Planet boundary
- Ωarag 3.44
- by 2023, 10% of arctic ocean will be under-saturated w/ aragonite all year; 2050 affected area increases to 50%
- Solutions
- modern zero-carbon energy technology and creative capital financing to fund transition away from fossil fuels
- geo-engineering (short term measure)
- common mineral, Mg2SiO4, sequesters CO2, produces HCO3- when dissolved in seawater, mimicking natural weathering process
- direct addition of lime (CaO) also sequesters CO2 and increases alkalinity of seawater
- -25% global carbon emissions absorbed by oceans
- stratospheric ozone (ozone layer)
- filters UV from sun
- solar breakdown of CFCs produces Cl- ions which are highly reactive to ozone
- Ozone hole
- in Antarctic: e.g. of threshold of ES being crossed
- CFC used as coolant for refrigerators in 1920s
- by 1985, up to 40% decrease in ozone layer over Antarctica
- Planet boundary
- <5% decrease in column ozone lvls wrt 1964-1980
- brought about by CFCs, cold temp, H2O gas, HNO3
- <5% decrease in column ozone lvls wrt 1964-1980
- Humanity's finest hour
- Vienna Convention for the Protection of the Ozone Layer signed in 1985 and the Montreal Protocol in 1987
- phase out halocarbons & HFCs for fridges
- most successful international agreement achieved
- ozone hole stopped growing, expected to return to pre-1980s lvl by 2060-2070
- Vienna Convention for the Protection of the Ozone Layer signed in 1985 and the Montreal Protocol in 1987
- nutrient flow (N&P)
- inert gaseous nitrogen converted to reactive nitrogen (NHx & NOx) via N-fixation, ammonification, nitrification
- returned to atmosphere via denitrification
- other sources of reactive N (e.g. N2)
- legume cropping
- fossil fuel
- biomass combustion
- other sources of reactive N (e.g. N2)
- returned to atmosphere via denitrification
- Haber-Bosch process
- conversion of N2 to NH3 @ industrial scale
- produces 435M tons of fertiliser annually
- Phosphorus Cycle
- phosphate primarily deposited in rocks
- released by geographical uplift & weathering
- interacts w biosphere, deposited into seabeds & sediments
- released by geographical uplift & weathering
- accelerated above natural processes
- mining (~20Mt/yr)
- agriculture (~10.5Mt/yr)
- phosphate primarily deposited in rocks
- Effects
- eutrophication
- increased biomass of phytoplankton & zooplankton
- dead zones
- hypoxia (low O2 areas) by decomposing aquatic vegetation
- occur near inhabited coastlines, where aquatic life is more concentrated
- eutrophication
- Planet boundary
- For N, limit industrial & agricultural fixation of N2 to 35 Mt/yr. ~25% of current levels
- For P, <10x reduction of the natural background weathering flux of ~1Mt/yr
- Solutions
- reduction of nutrient runoff
- no-till farming
- improved international sewage treatment
- buffer zone
- better farm practices
- avoid over-fertilisation
- plant biotech
- GM crops that require less fertiliser
- reduction of NOx emissions from fossil fuel combustion
- improve animal management strategies
- manure management
- conservation of natural nutrient sinks
- wetlands
- increasing iron concentrations in freshwater lakes
- co-precipitation of P
- reduction of nutrient runoff
- inert gaseous nitrogen converted to reactive nitrogen (NHx & NOx) via N-fixation, ammonification, nitrification
- biodiversity loss
- biodiversity importance
- sustain ecosystem services and functioning
- prevent ecosystems from tipping into undesired states
- larger no. of functionally similar species, greater stability
- Threats
- Overexploitation
- Habitat loss
- Invasive species
- Pollution
- Climate change
- 6th Mass Extinction
- >75% loss of species over geologically short interval
- current rates higher than predicted
- due to anthropogenic factors
- Indicator trends
- declines in state of biodiversity
- increase in pressures
- increase in responses to pressures
- examples of impact on environment
- overhunting of sea otter for fur
- collapse of kelp forest from overabundance of grazing sea urchins
- loss of 6 apex shark species
- collapse of scallop fishery in N. Carolina due to increased abundance of cownose ray
- overhunting of sea otter for fur
- affects ecosystem processes
- primary productivity
- decomposition rates
- Planet boundary
- interactions w/ other PBs
- current: >100 E/MSY (extinctions per million species-years), expected to increase 10-fold within the century
- proposed PB: 10E/MSY
- Aichi Biodiversity Targets
- address causes
- reduce direct pressures, promote sustainability
- safeguard biodiversity
- enhance benefits
- planning, knowledge management & capacity building
- Intergovernmental Science-Policy Platform on Biodiversity & Ecosystem Services
- implementing monetary value on ecosystem services
- natural capital
- payment go to communities to keep ecosystem intact
- e.g. Mexico: fraction of water charges given to farmers to protect forests
- offsets/credits to compensate for impacts from mining etc.
- Aichi Biodiversity Targets
- biodiversity importance
- freshwater loss
- land systems change
- aerosols
- chemical pollution
- climate change
- Estimates safe operating space for humanity wrt functioning of Earth System (ES)
Información
- Descripción
- Mapa Mental sobre The Anthropocene, creado por Kok Ai el 08/11/2016.
- Creado por
- Kok Ai
- Visitas
- 2
- Valoración