
Apuntes
QUALITY MANAGEMENT - created from Mind Map
Contenido del apunte (1)
Página 1
Specialized language
Continuous Improvement
well-defined and recognisable linguistic corpu
conceptualize it correctly
appropriate terminology
Key terms
iservir
SERVIR
words just for your correct understanding of daily activity or academics.
to give it its own theoretical framework that responds to its degree of progress.(Magaña Carrillo, 2016)
define their field of study and thus understand their scope on the road to quality and competitiveness.(Magaña Carrillo, 2016)
"An effort has been made to define the key terms, not as a pedantic exercise, but because definitions are difficult to understand and this is indispensable for taking appropriate action" (ibid.).
iservir is strategically planning the unfolding of the Servuccir Line in order to serve the intangible product, the qualitative product, the intangible-qualitative product and its delivery or servuccir from a flexible design process.(Magaña Carrillo, 2016)
To serve in the Qualitative Quality approach is to'Be useful', so it is essential to do quality or to unfold the delivery procedure: what you need, how you need it, when you need it; what you expect, how you expect it, when you expect it; what you want, how you want it and when you want it.(Magaña Carrillo, 2016)
What is it?
Advantages
PDCA Cycle
Quality Assurance
the management of total quality requires a constant process, which will be called Continuous Improvement, where perfection is never achieved but always sought. (Deming ,1996)
It concentrates its efforts on organisational areas and specific procedures
They achieve improvements in the short term and visible results.
Plan -Logical organization of work
Do- Correct performance of planned tasks
Check- Verification of achievements
Adjust -Possibility of taking advantage of and extending learning and experience gained in other cases
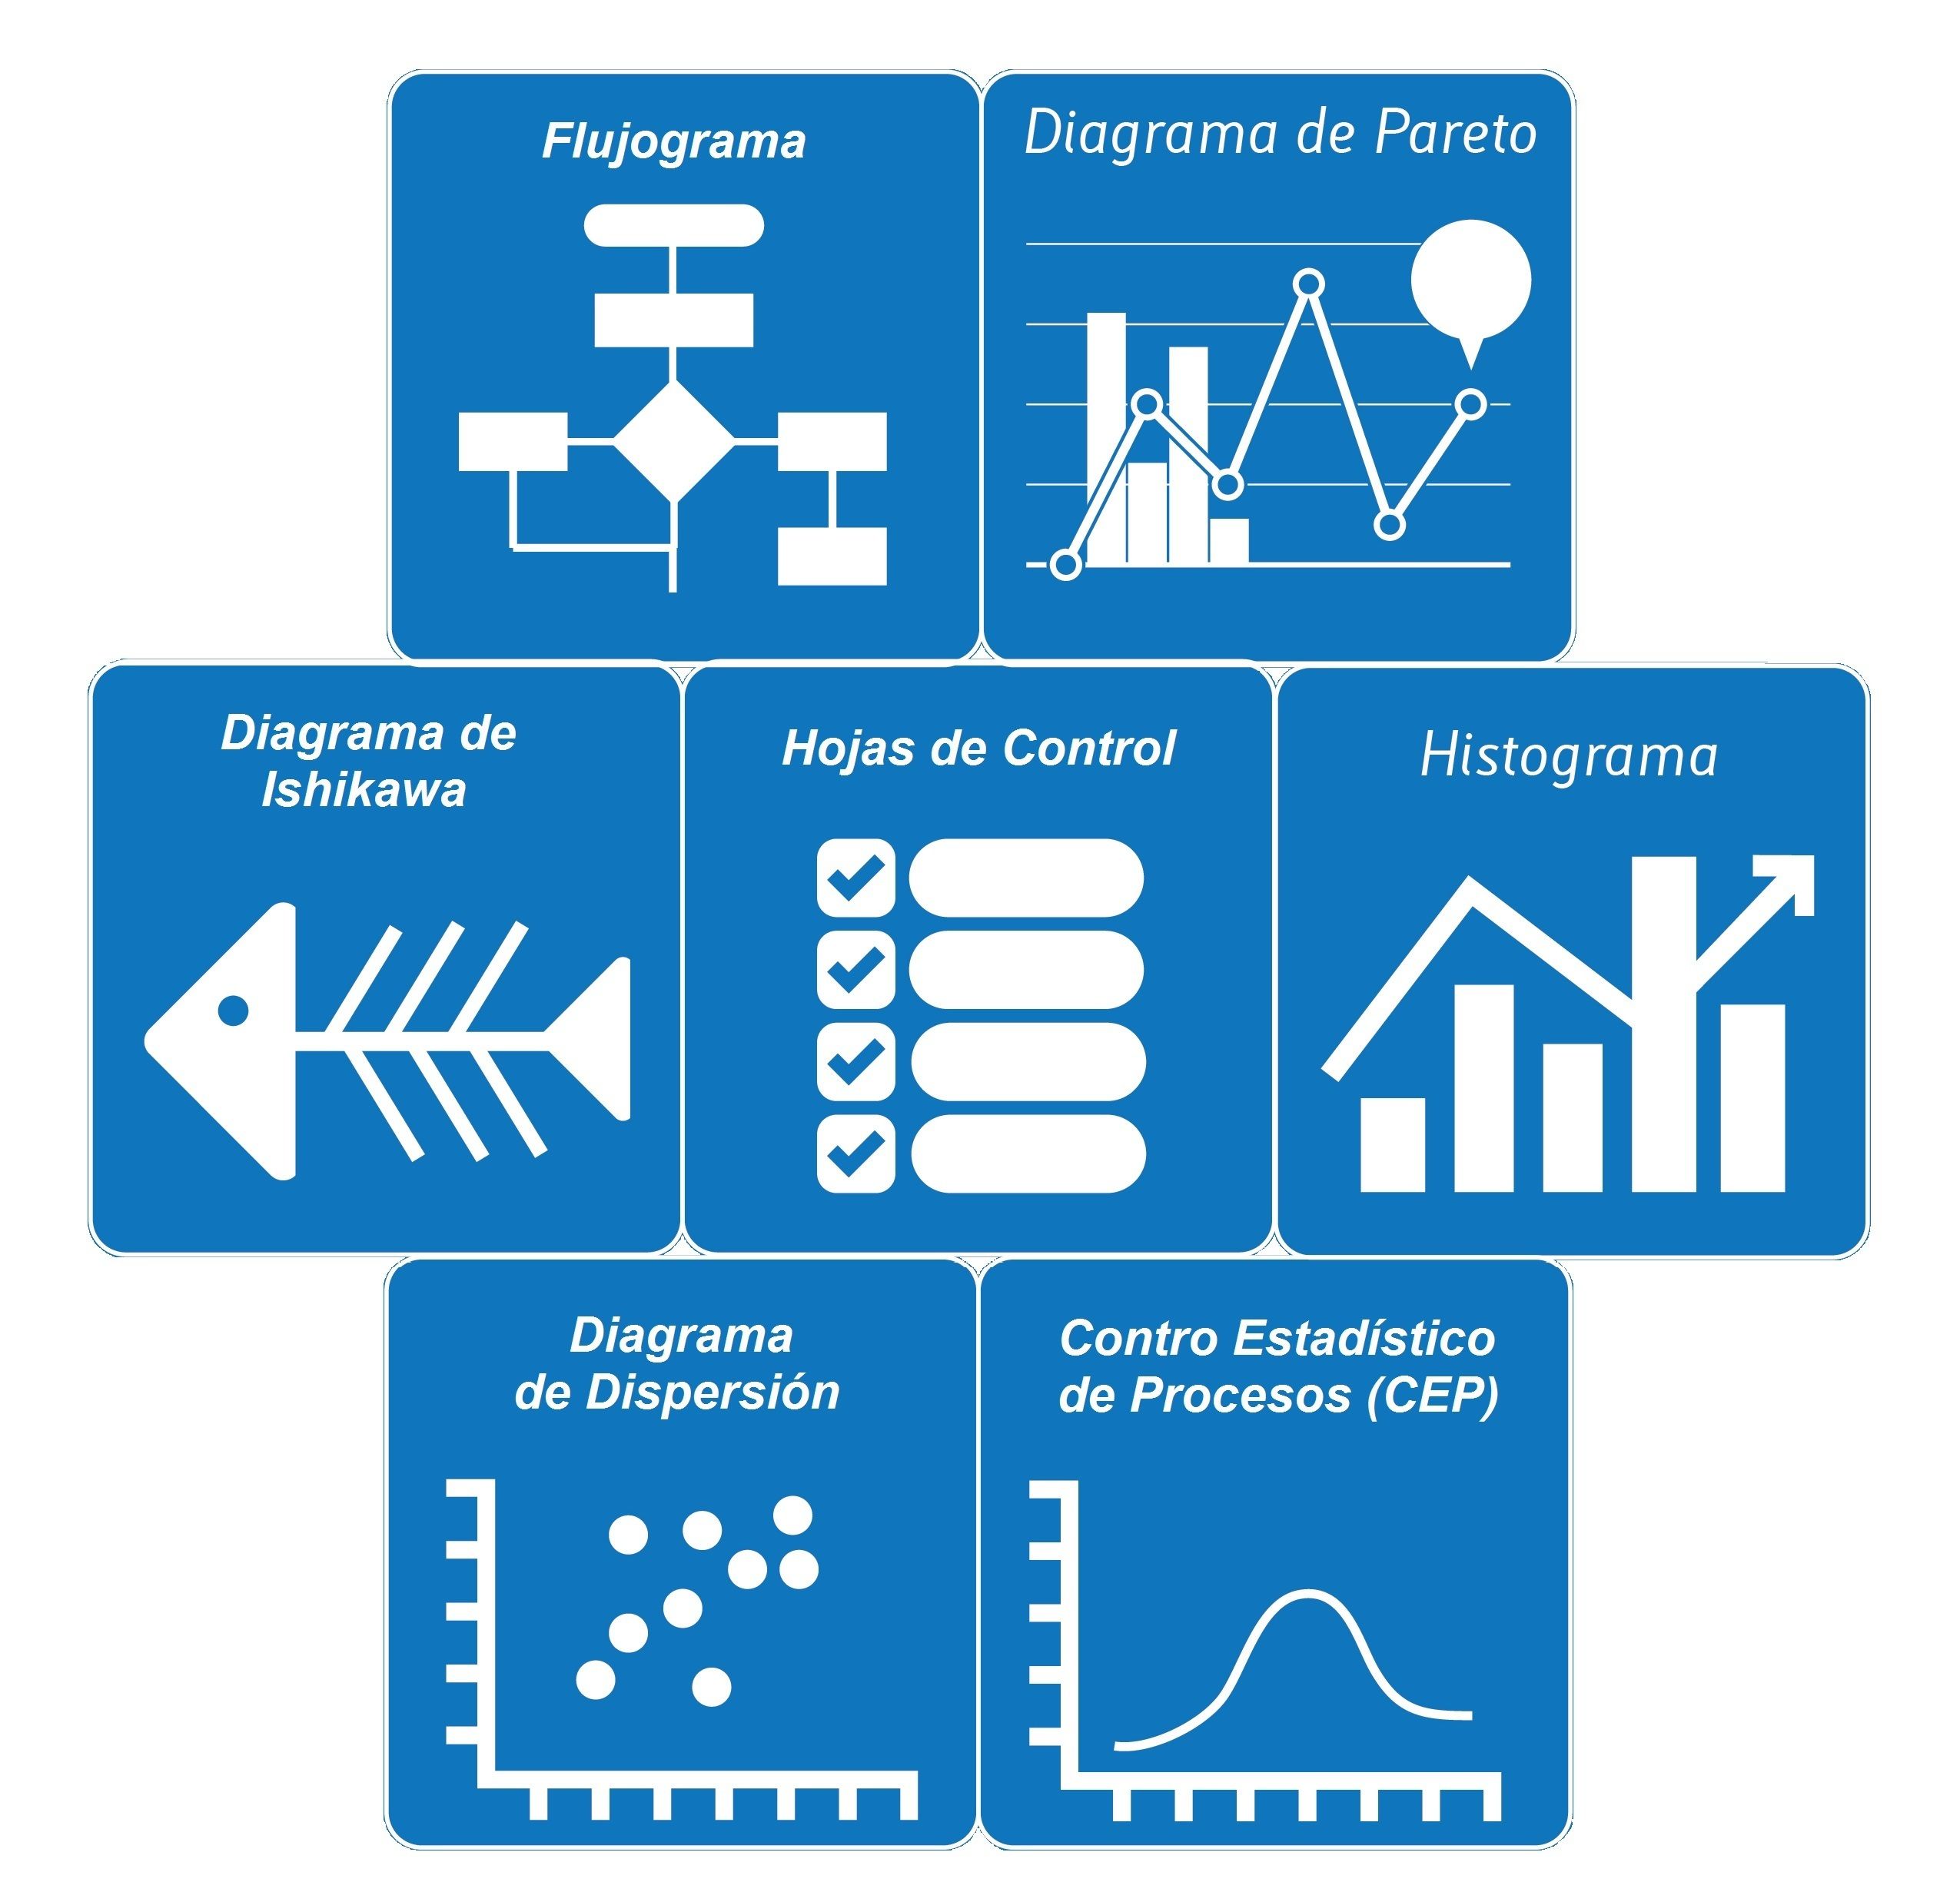
The 7 Basic Quality Tools
To practice Quality Control is to develop, design, manufacture and maintain a quality product that is the most economical, the most useful and always satisfactory for the consumer.(Ishikawa, 1985)
The flowchart
Dispersion Diagram.
Pareto diagram
Histogram
Control Charts.
Checklist Sheet
Cause - Effect Diagram
is used to segment the process into its most elementary parts, showing the relationships between the activities that make it up.
Tool that helps to identify the possible relationship between two variables.(Ishikawa ,1985)
A method of analysis that makes it possible to discriminate between the most important causes of a problem (the few and vital) and those that are less important (the many and trivial).(Ishikawa ,1985)
A vertical bar graph representing the frequency distribution of a data set.(Ishikawa ,1985)
Statistical tool used to monitor and improve a process by analyzing its variation over time.(Ishikawa ,1985)
Recording of data relating to the occurrence of certain events, using a simple method.(Ishikawa ,1985)
. It helps to identify, classify and highlight possible causes of both specific problems and desired effects.(ishikawa,1985)


Información
- Descripción
- Apunte sobre QUALITY MANAGEMENT - created from Mind Map, creado por Paloma Dávalos el 27/06/2018.
- Creado por
- Paloma Dávalos
- Visitas
- 2
- Historial
-
- Creado por Paloma Dávalos · 27 jun 2018
- Copiado a Apunte por Paloma Dávalos · 27 jun 2018
- Valoración