
Apuntes
Probability & Statistics - Part 2
Contenido del apunte (5)
Página 1
K-S Test for similarity of two distributions
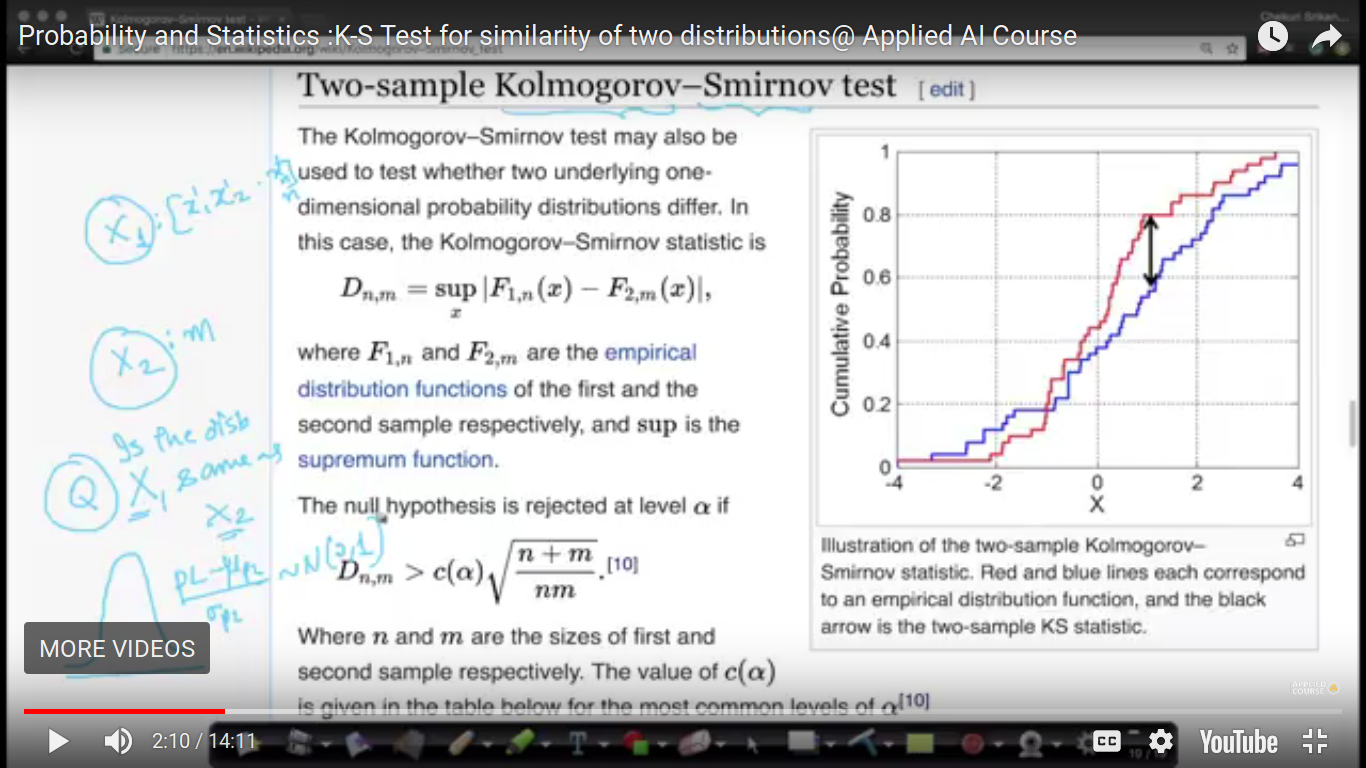
This test basically says that if two random variable follows the same distribution or not.
Here, if petal length follows N(0,1) or similar to it then the below formula says that it is having petal length follows normal distribution having mu(pl) and sigma(pl).
When n and m are very large may be millions or billions respectively and if the random variable follows the same distribution. Then, they follow the overlapping CDF's(Cumulative Probability) shown in below attachment.
where N, M are samples.
X1, X2 are random variables.
Note -
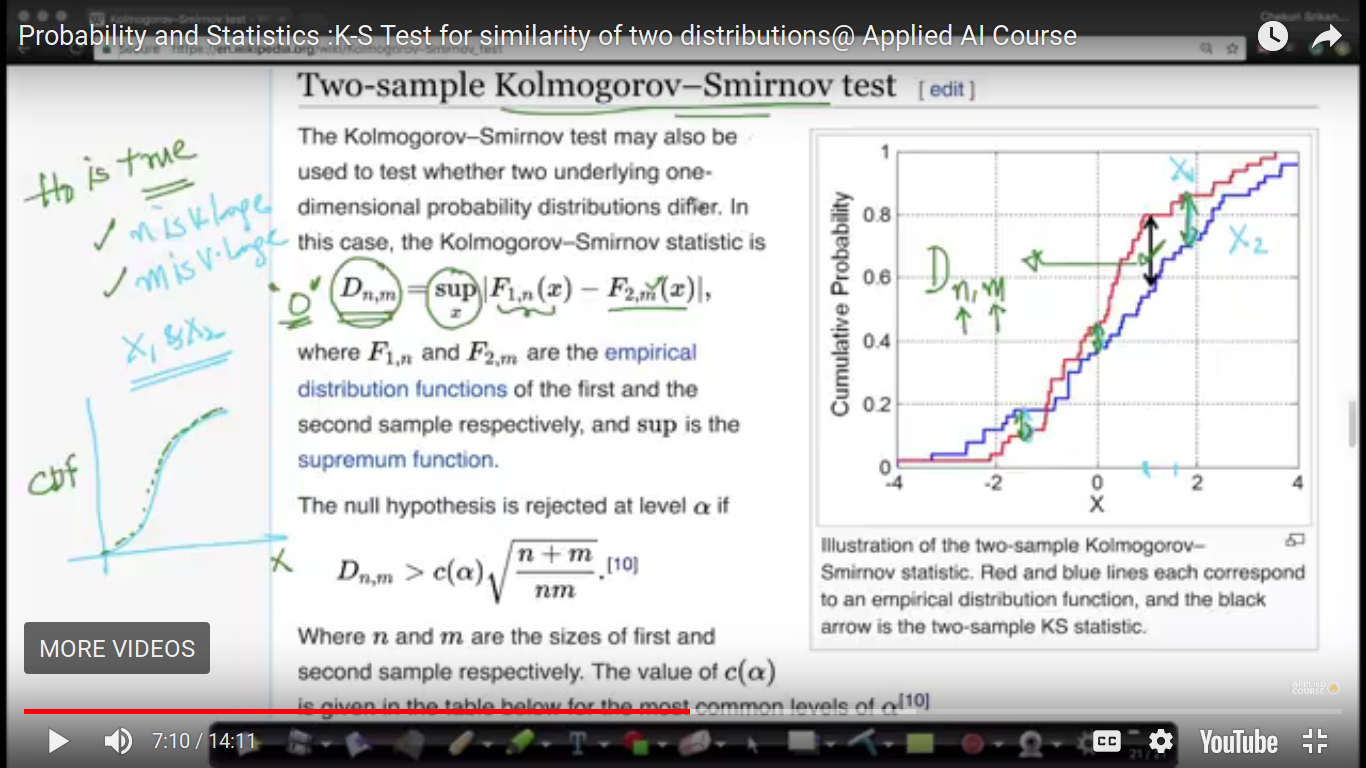
D(n,m) is test Statistics.
F(1,n)X is a CDF of the random variable X1 with n samples.
supremum is the maximum distance at any point x between two random variables.
> If n and m are very large and it came from the same distribution i.e test hypothesis, H0 is true then D(n,m) is zero.
> Otherwise, H0 seems to be false i.e X1 and X2 do not come from the same distribution then (n,m) is greater than zero
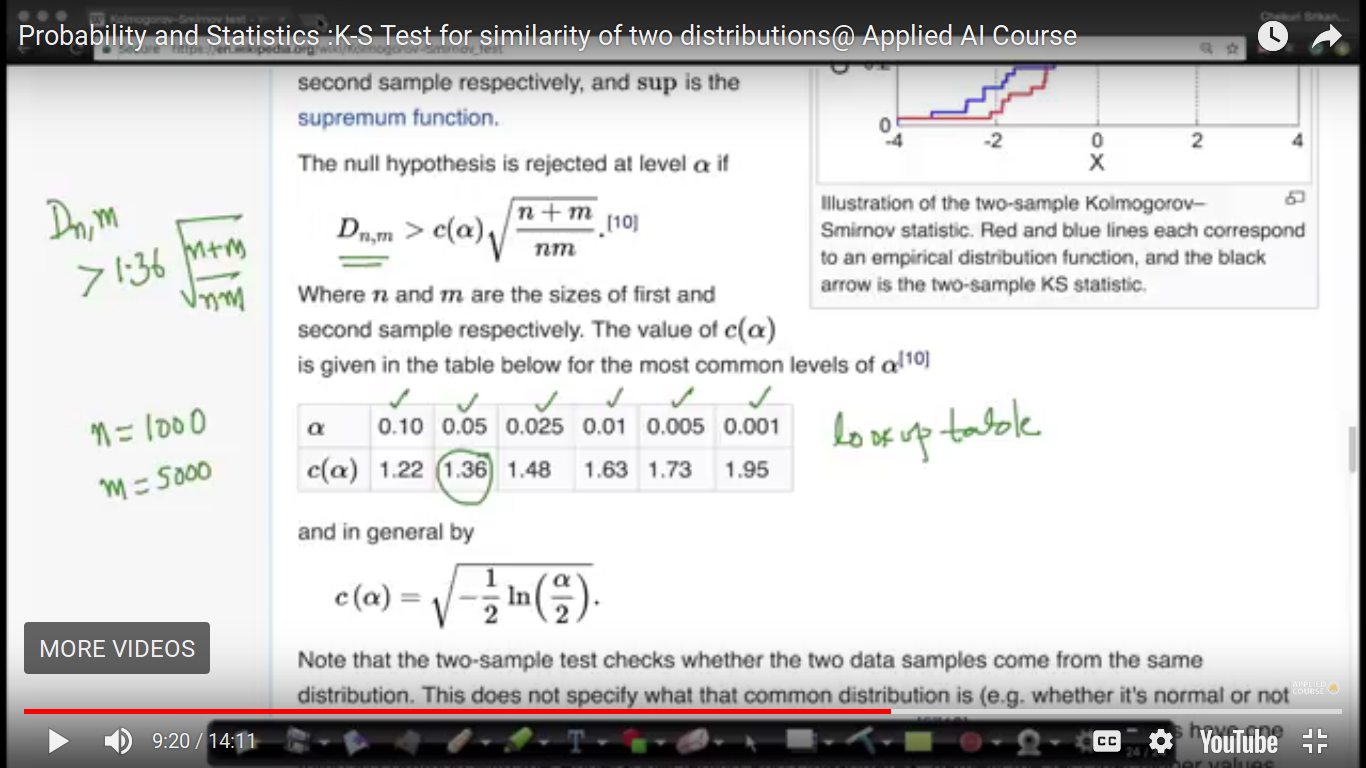
P-value or Significance level(alpha)
Loo Up Table for calculating c(alpha) i.e kind of a constant.
Example -
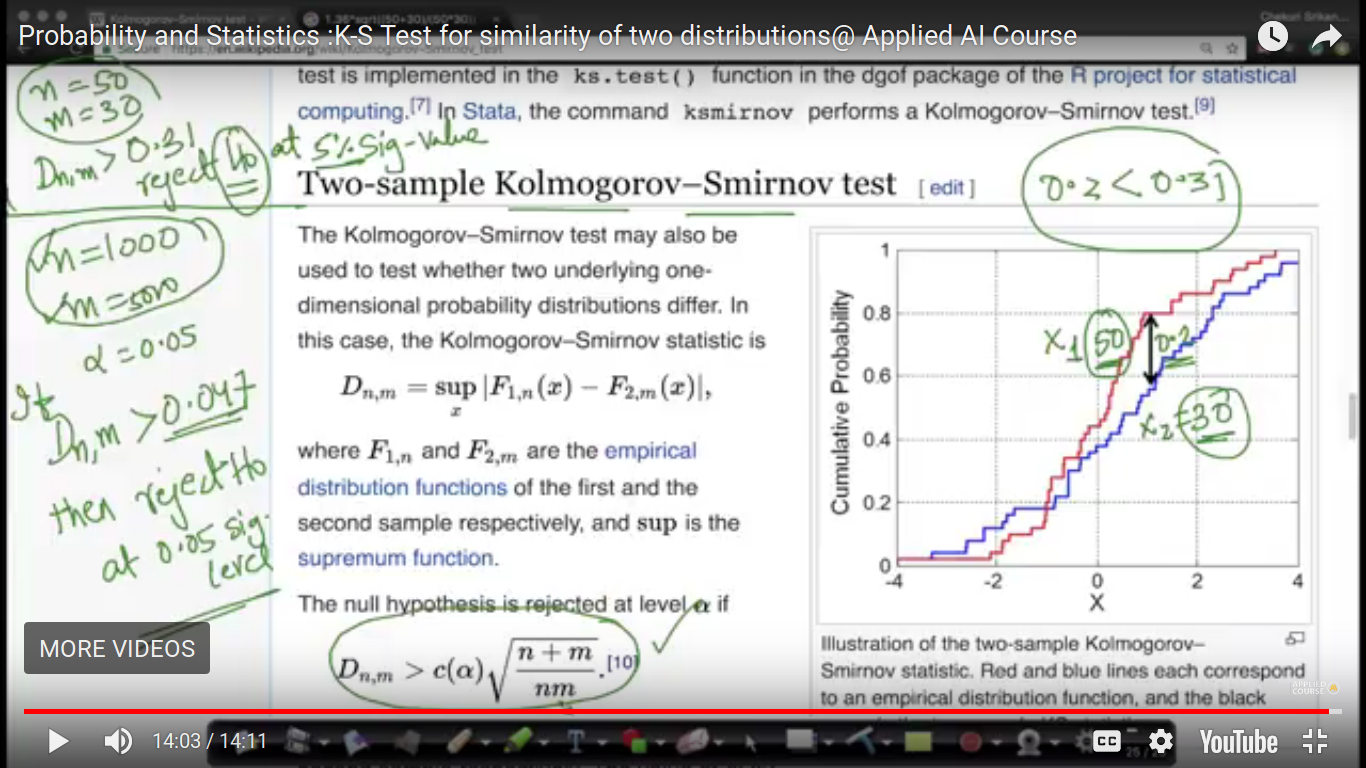
if n=50, m=30 i.e very small
let's take alpha= 0.05 i.e 5 percent.So, value corresponding to alpha=0.05 is 1.36.
On Calculation, D(n,m) is 0.31 and observed difference 0.2 i.e less than the calculated value.
i.e test statistics is less than the threshold value.
Hence, if D(n,m) > 0.31 does hold then we reject H0 null hypothesis for the random variable to be of the same distribution at 5 percent significance level but we found opposite so we accept the null hypothesis that they have come from the same distribution.
Página 2
Code Snippet K-S Test
Generating an array of size 1000 using the stats module of Scipy.
sns.kdeplot(take a parameter as numpy array: It plots the pdf of kernel density distribution.
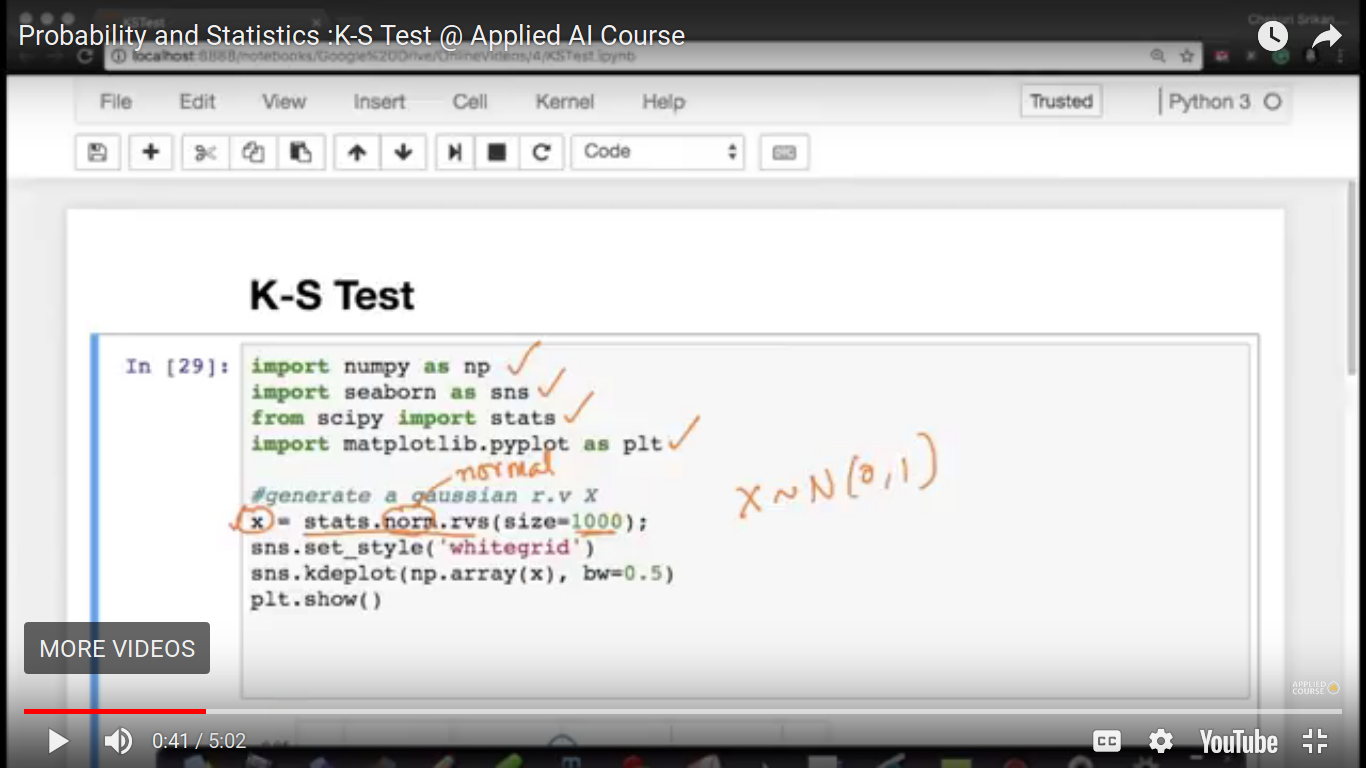
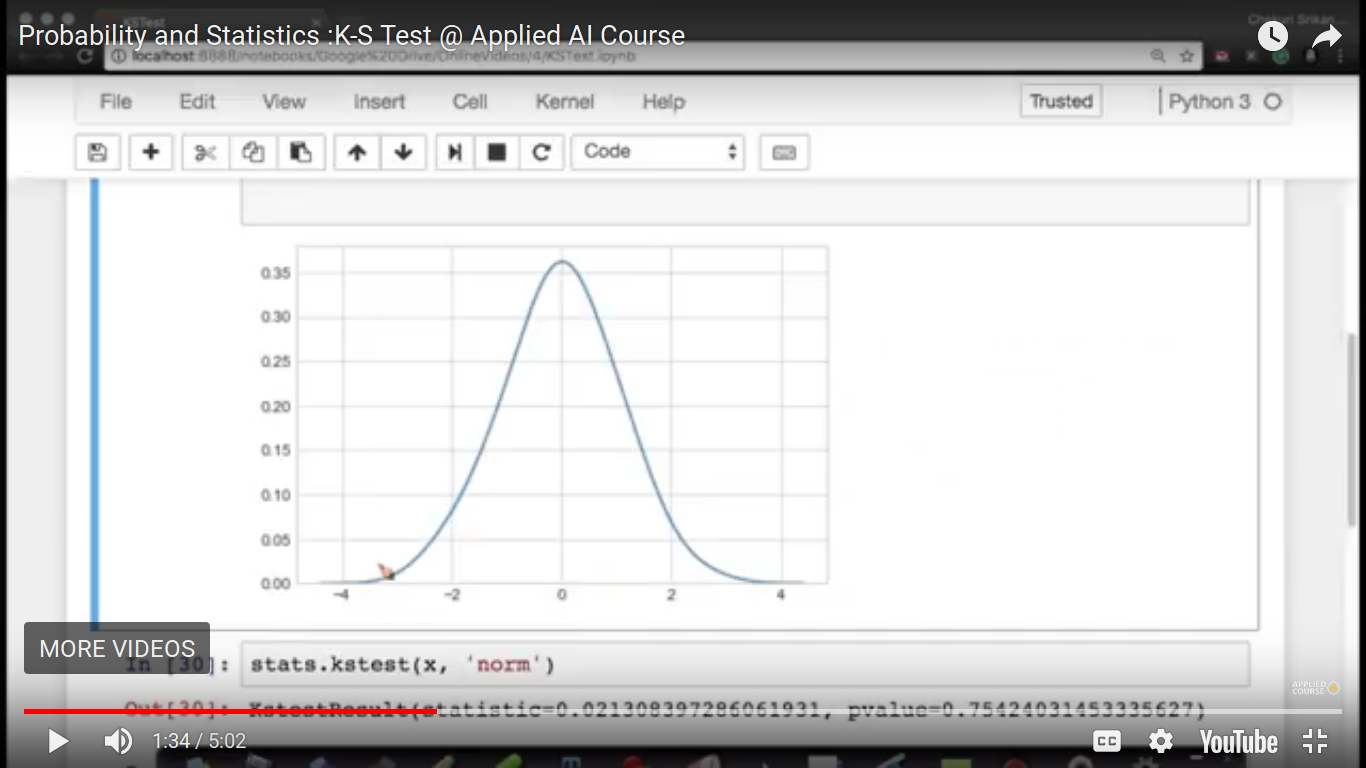
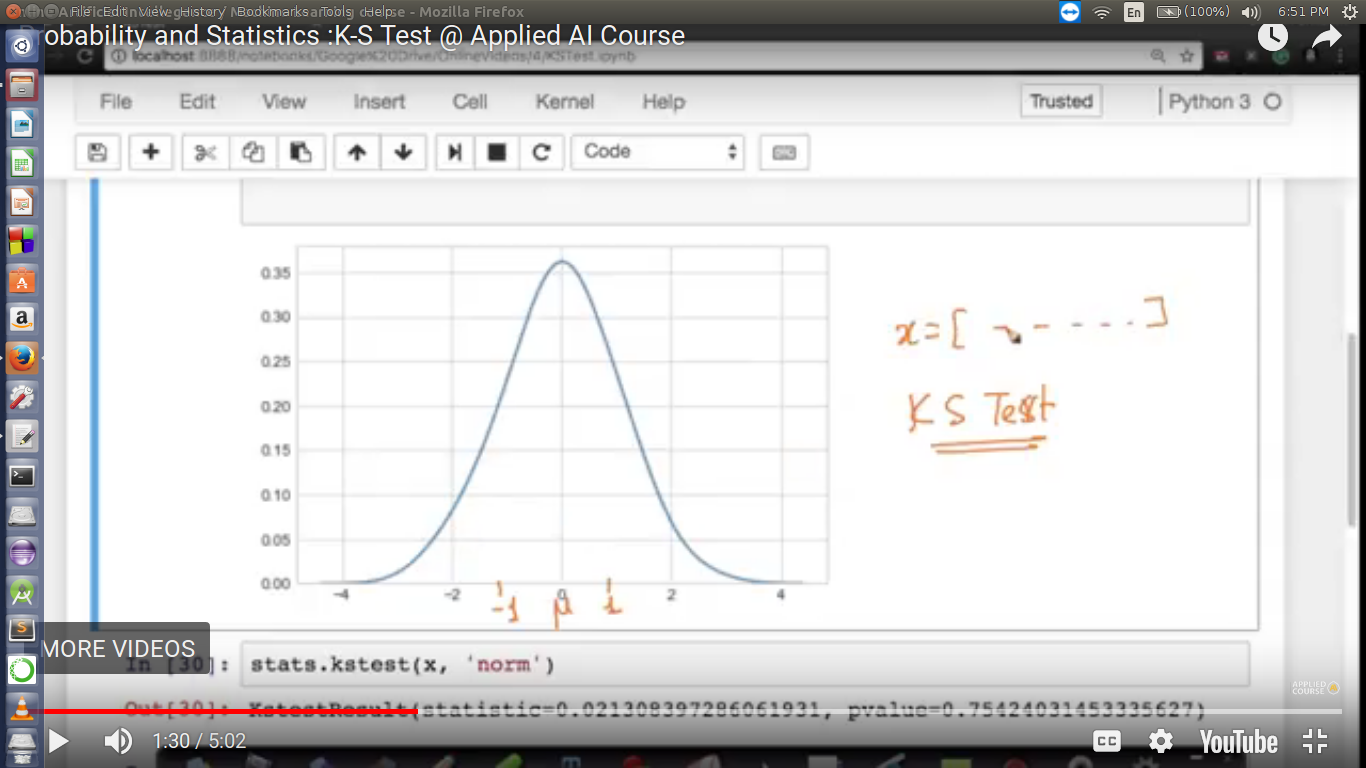
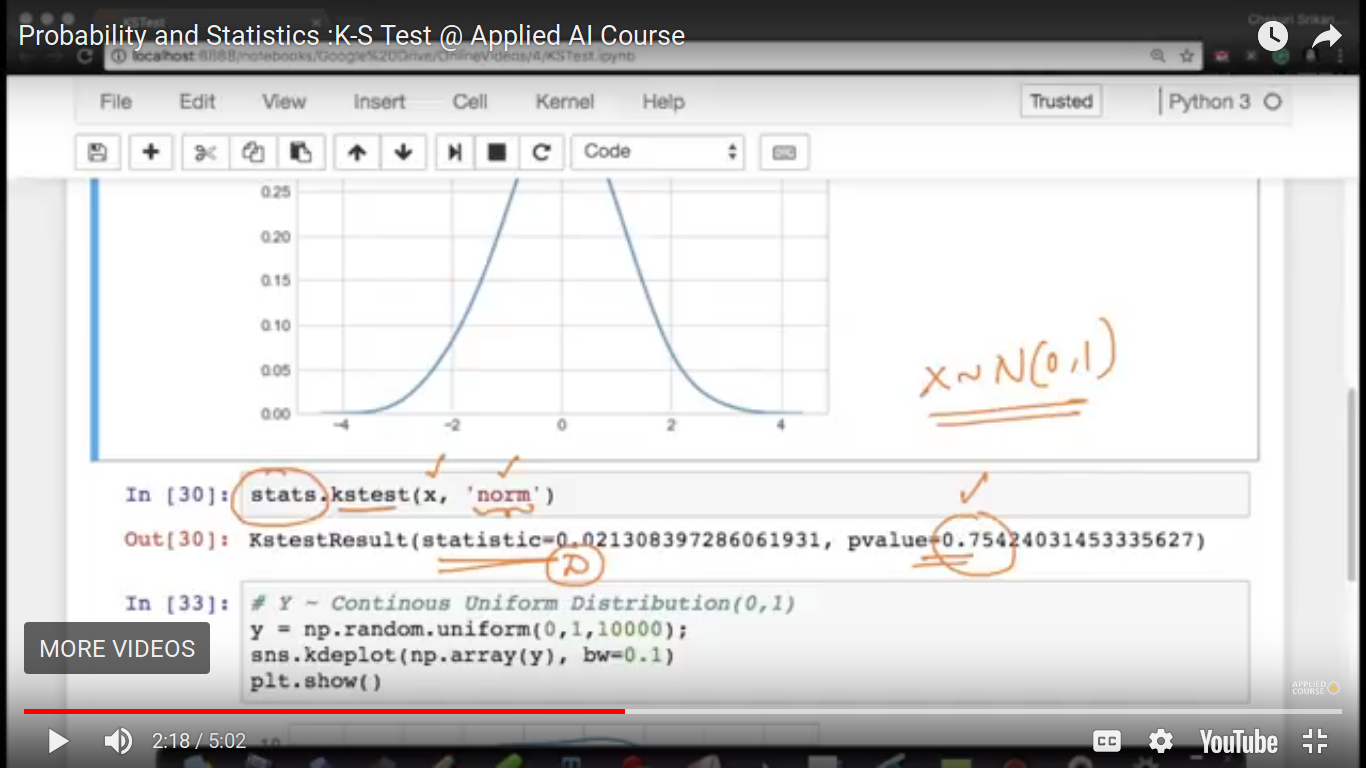
Now, I will check the above things that the values of x follow Normal distribution or not by using the K-S Test in just one line of code.
Here, below attachment shows that we get two value i.e D-value and P-value. And it is shown that the p-value is very large, it means it follows a normal distribution, N(0,1).
We had seen a positive case before. Now, check for an opposite or negative case.
So, let's take a uniform distribution. It is shown that if it follows a Normal distribution, then value lies in between 0 and 1.
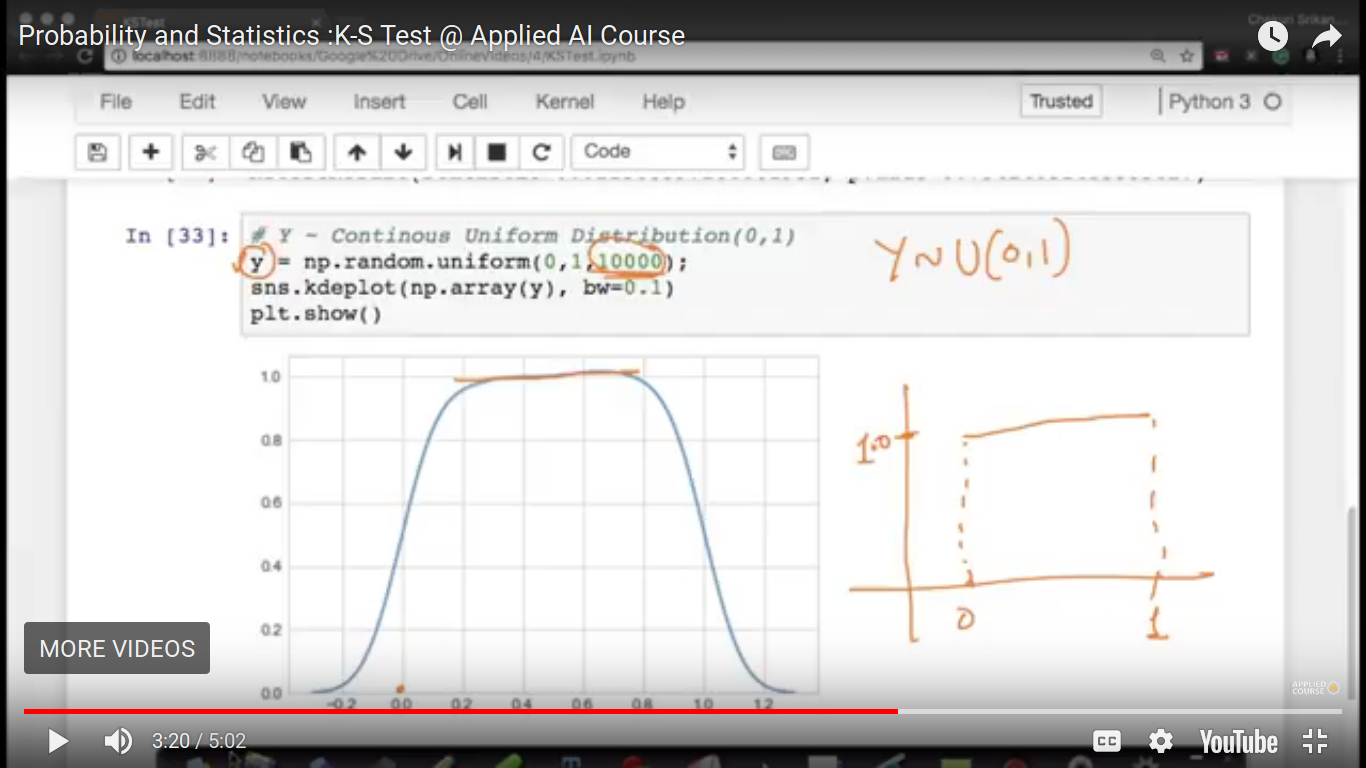
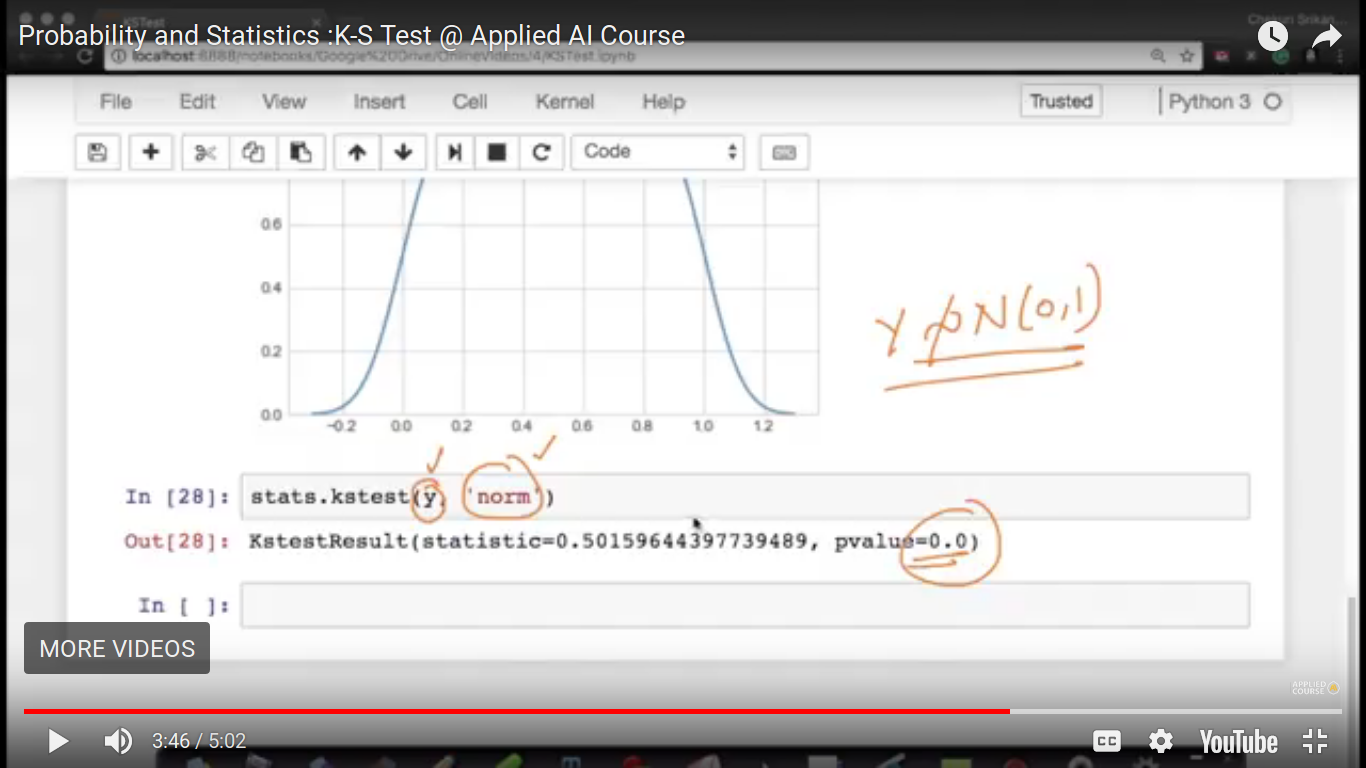
Here, a p-value is 0 i.e so small. It means doesn't follow a Gaussian distribution.
Página 3
Hypothesis Testing Intution with coin toss example
We are here trying to solve a coin tossing problem using Hypothesis testing.
Here, test statistics are a number of heads.
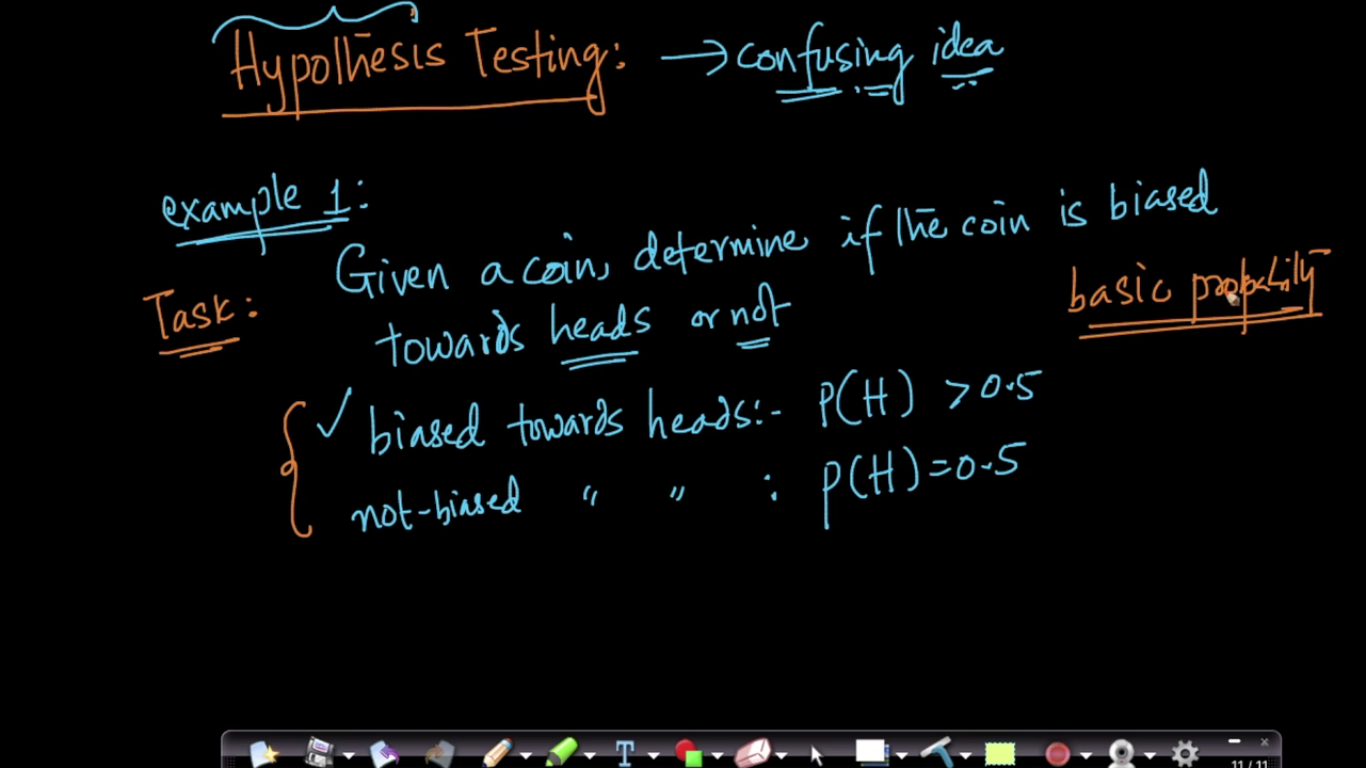
So, we design an experiment first. We get test statistics on observation is X=5.
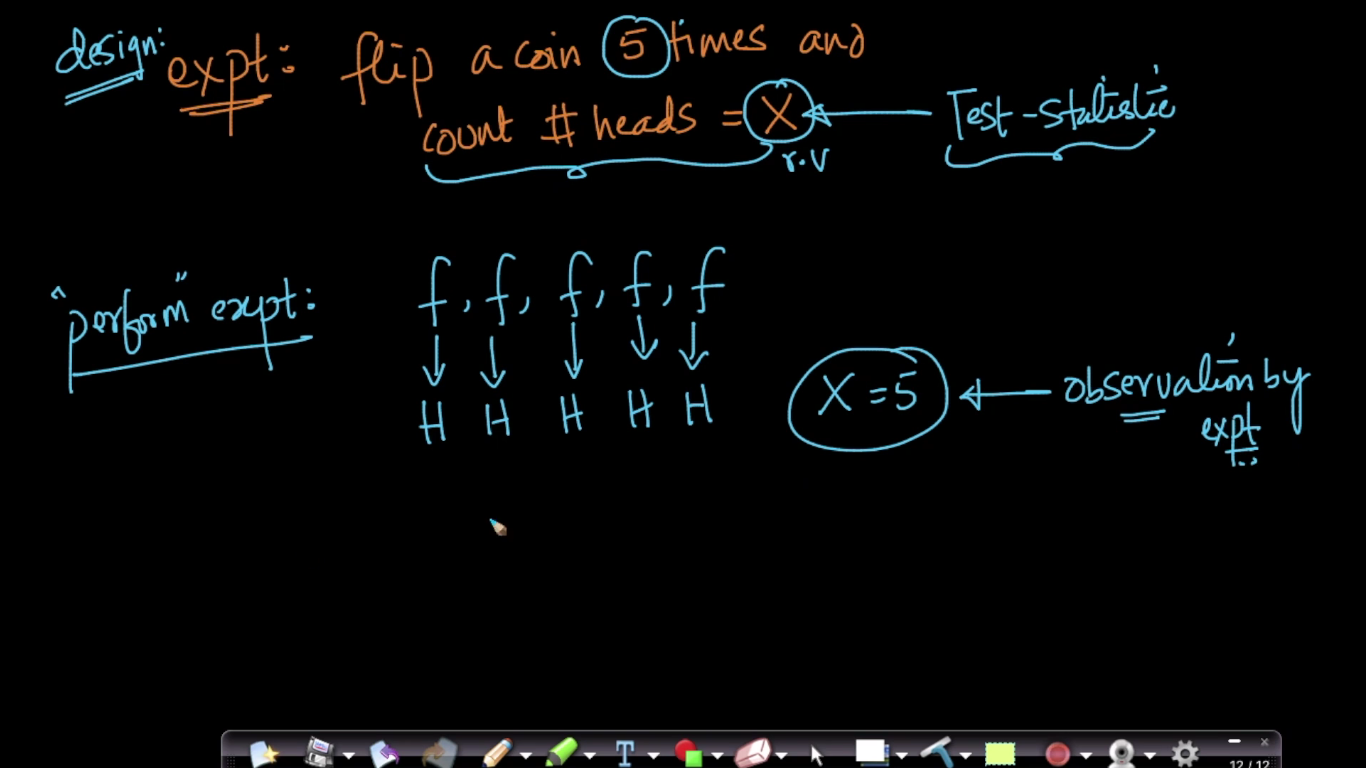
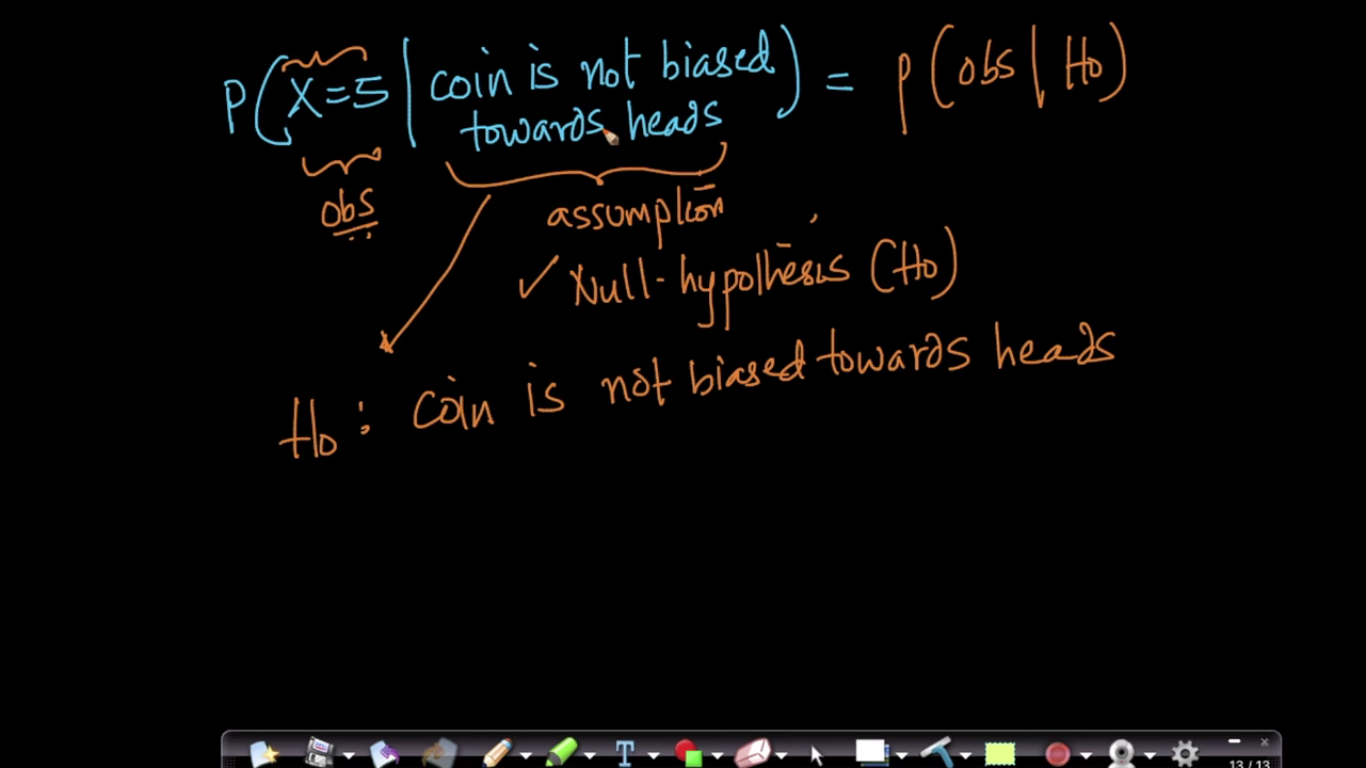
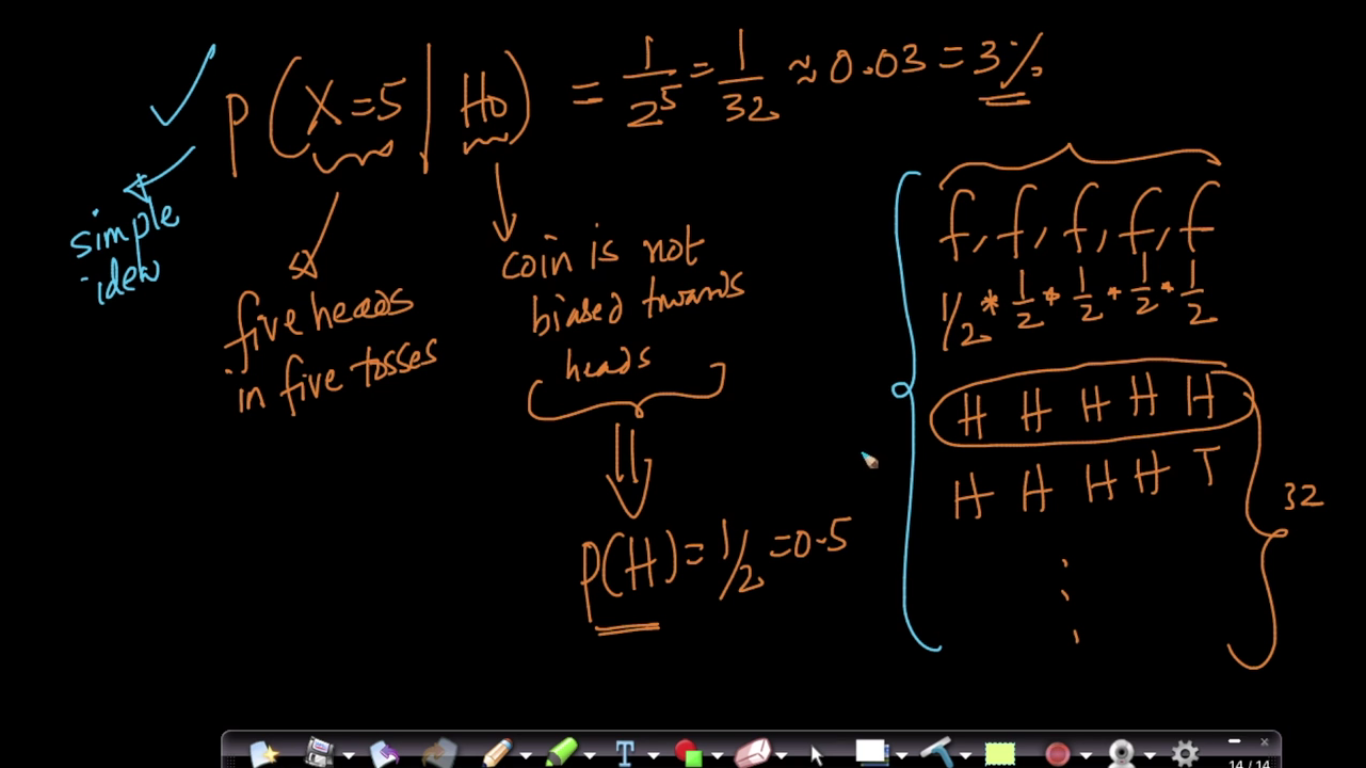
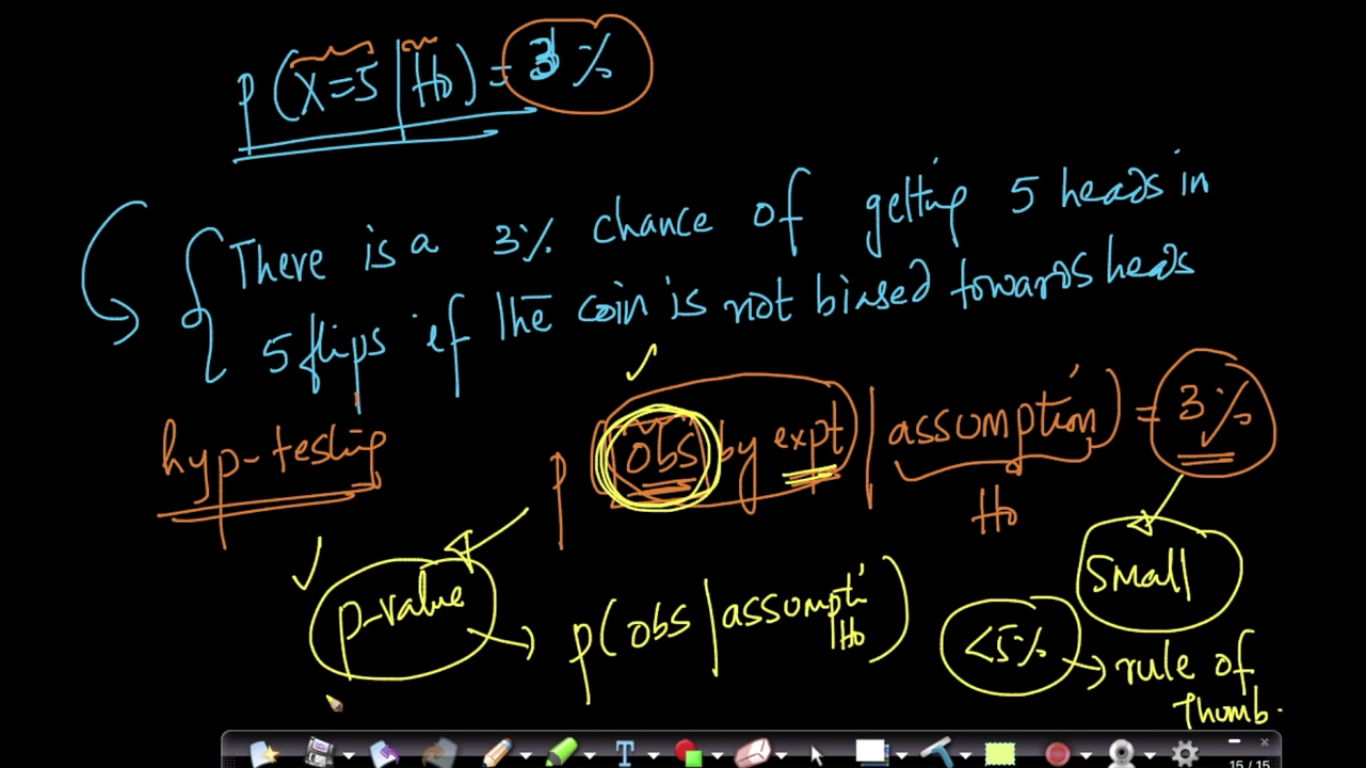
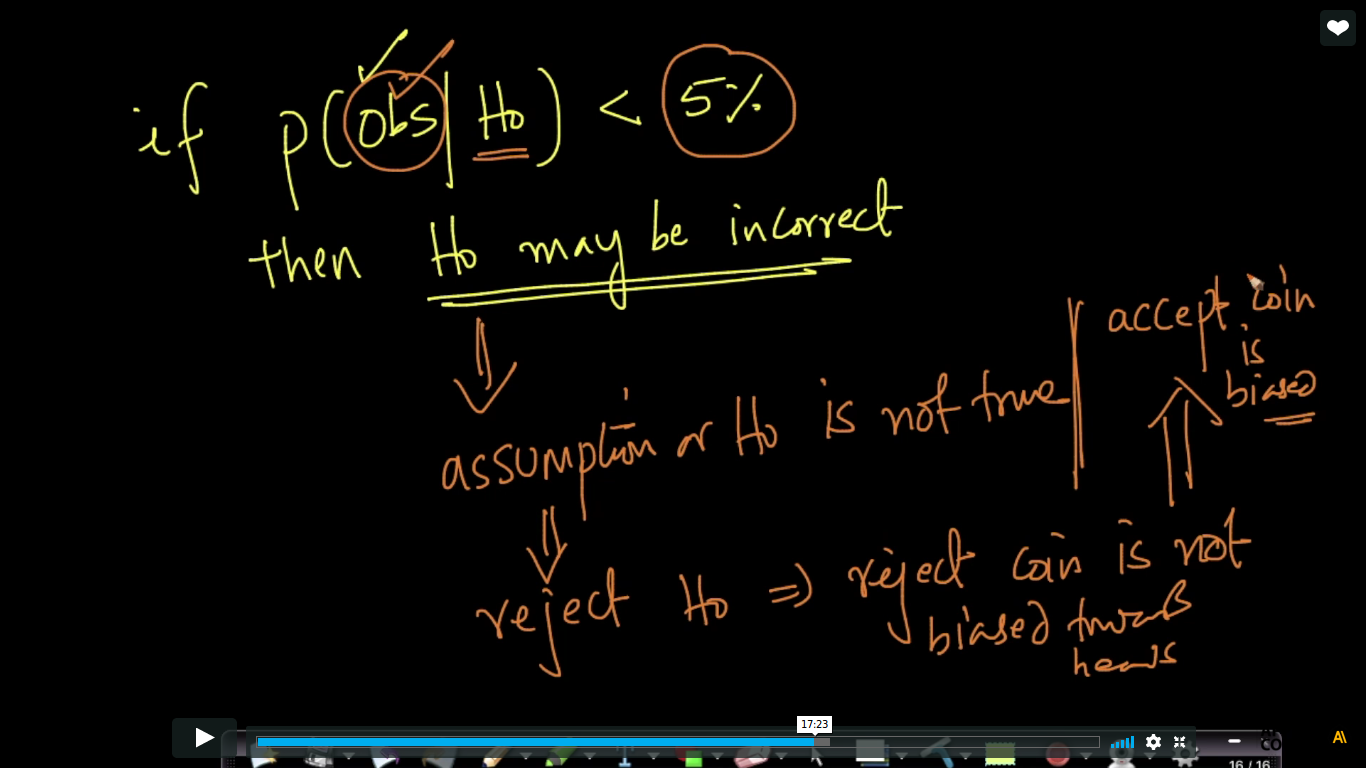
The above Analysis is called Alternate Analysis(H1).
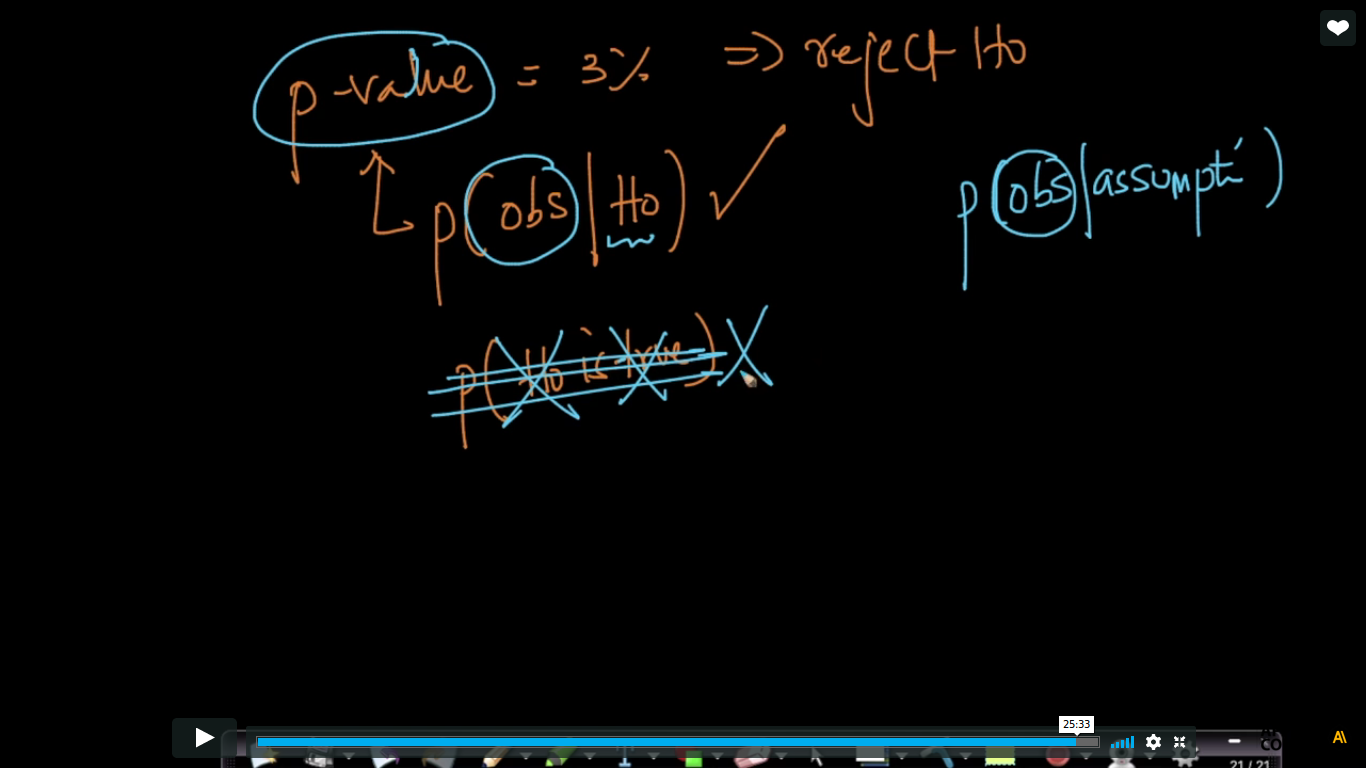
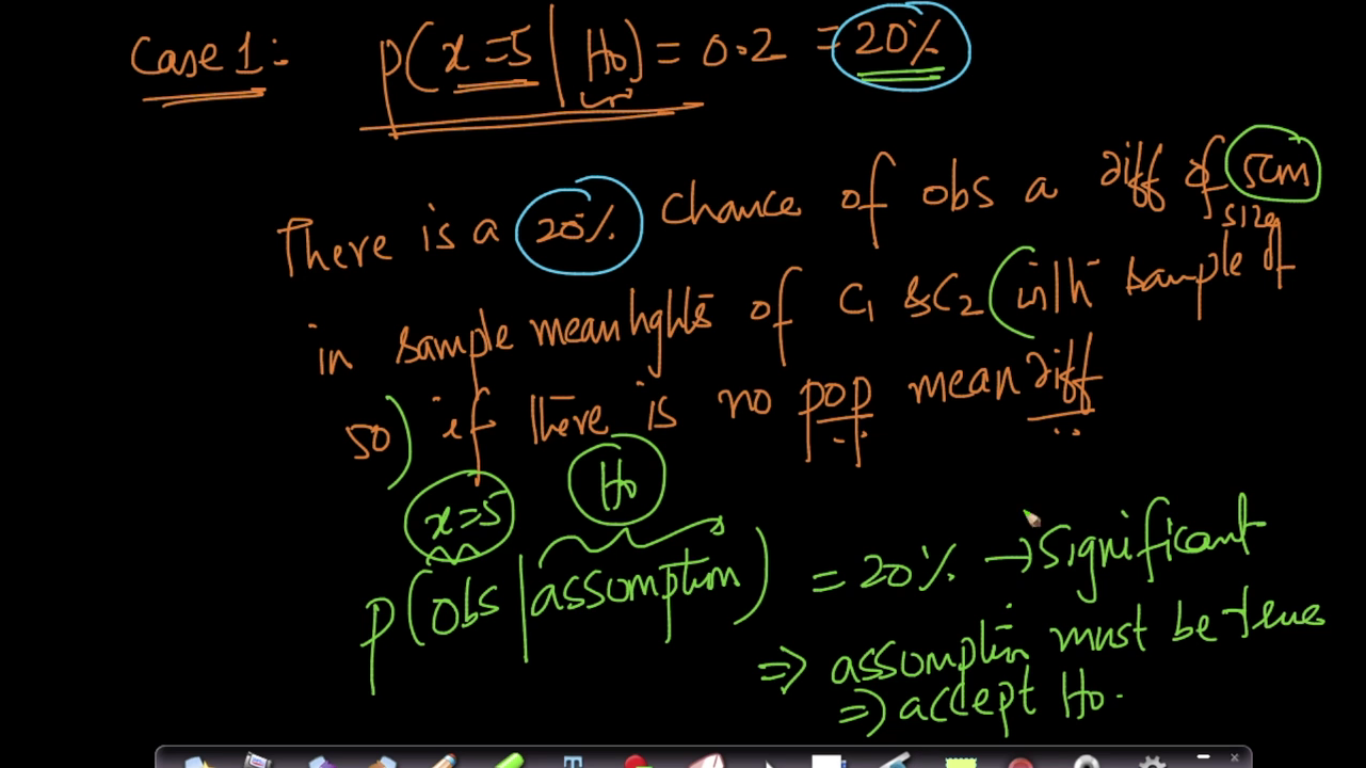
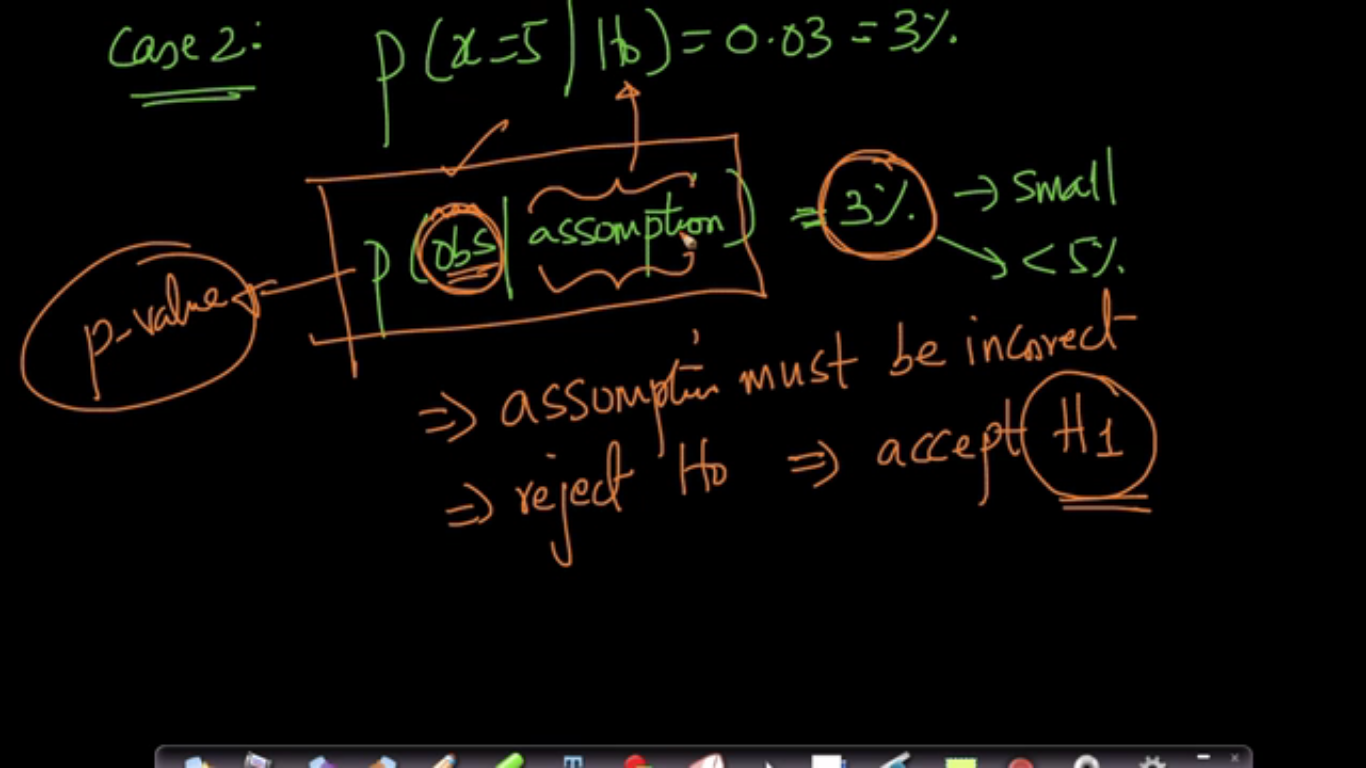
The observation we follow is not incorrect but probably may be an assumption is incorrect because of the probability of its finding gets 3 percent in our case with this assumption.
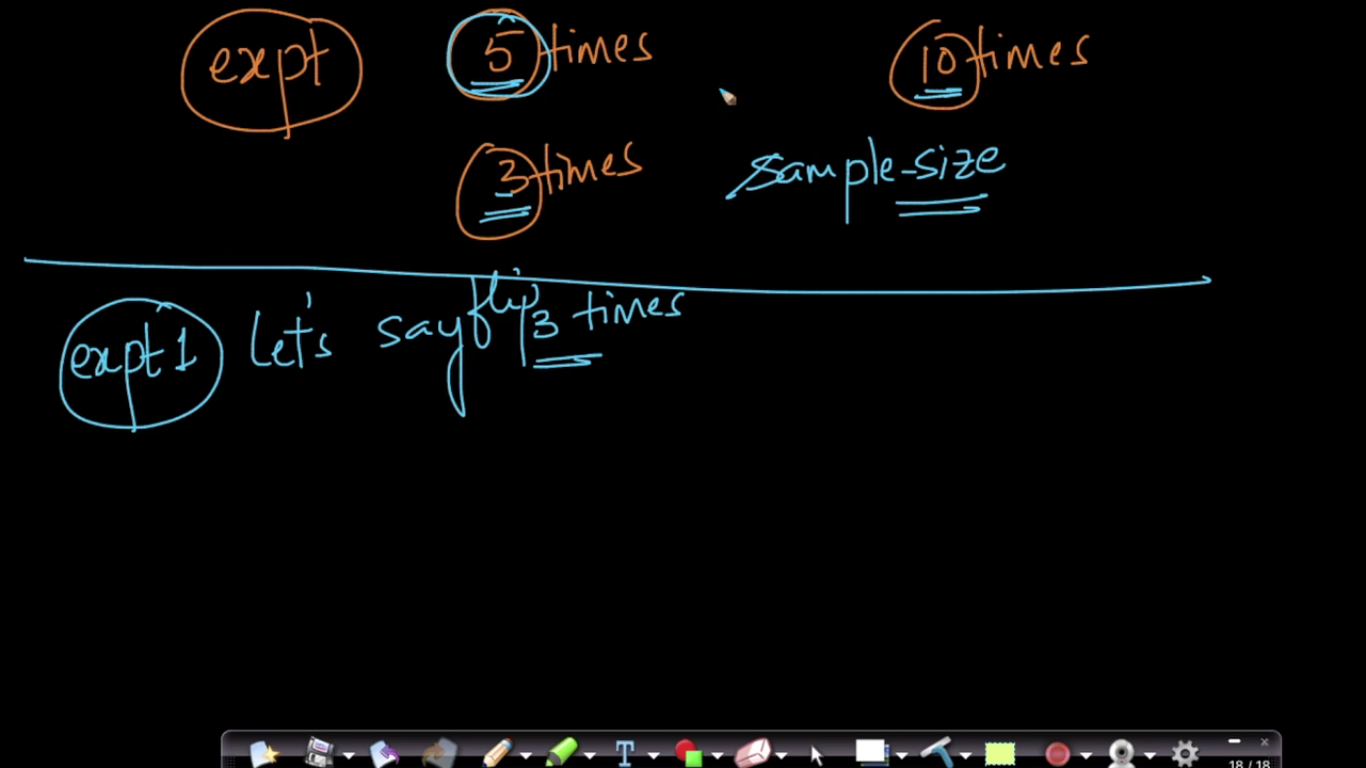
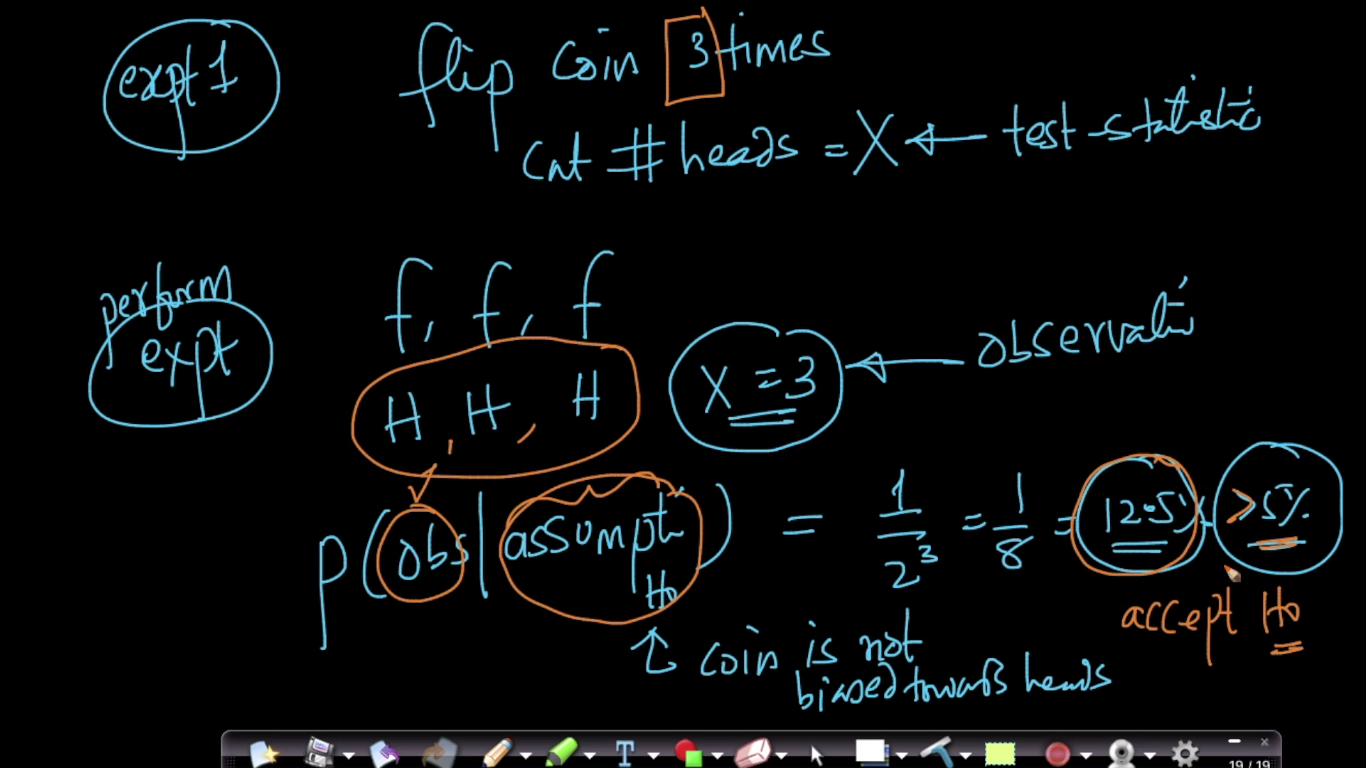
Here, above let's take another experiment completely independent from the previous one. Here sample size is 3 times and we observe that instead, the coin is unbiased, we get 3 heads. So, the probability of our observation with the given assumption is 12.5 percent which is significantly larger than 5%. So, we accept H0 in that case.
So, the conclusion is that we need to be very careful about the sample size for Hypothesis testing.
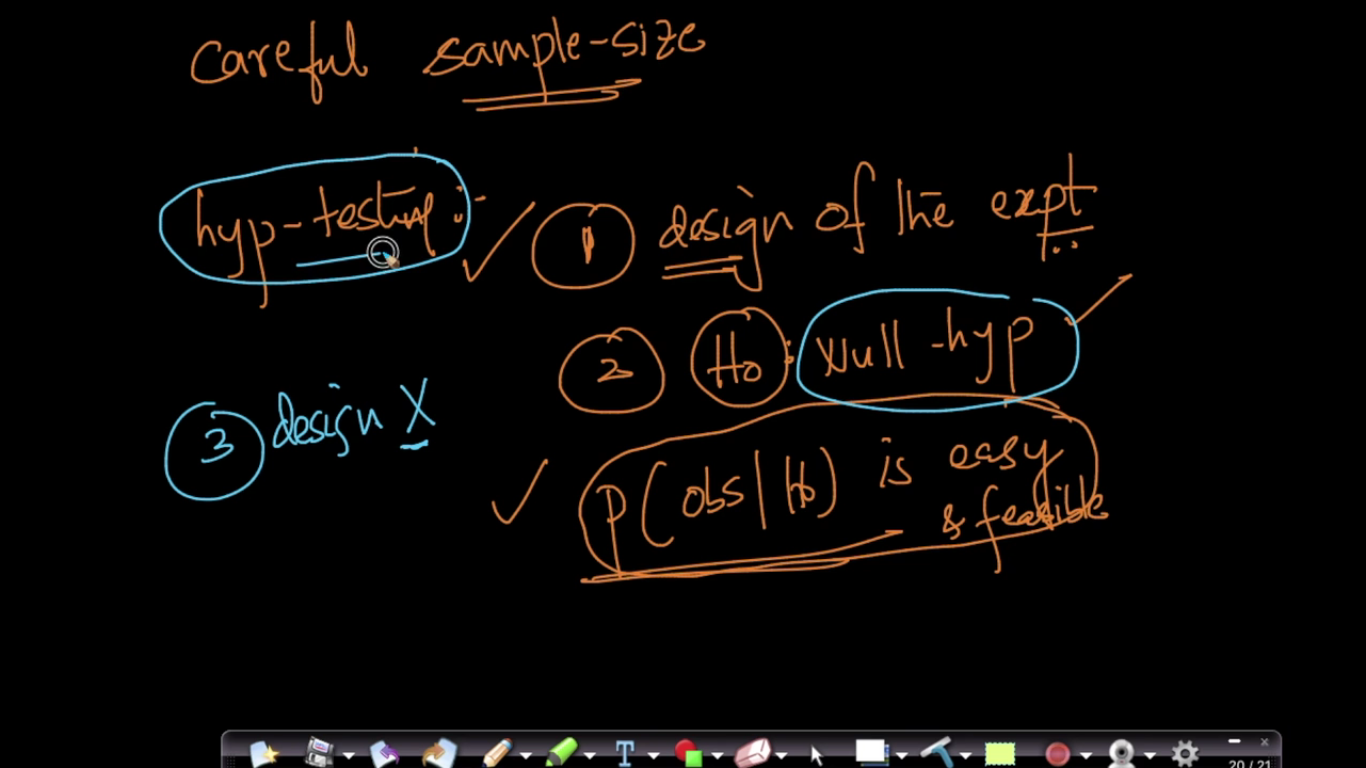
Three things to remember for hypothesis testing -
1. The design of the ex.periment.
2. Make your null hypothesis so easy & feasible i.e so that easy to find the probability.
3. Design the test statistics.
Página 4
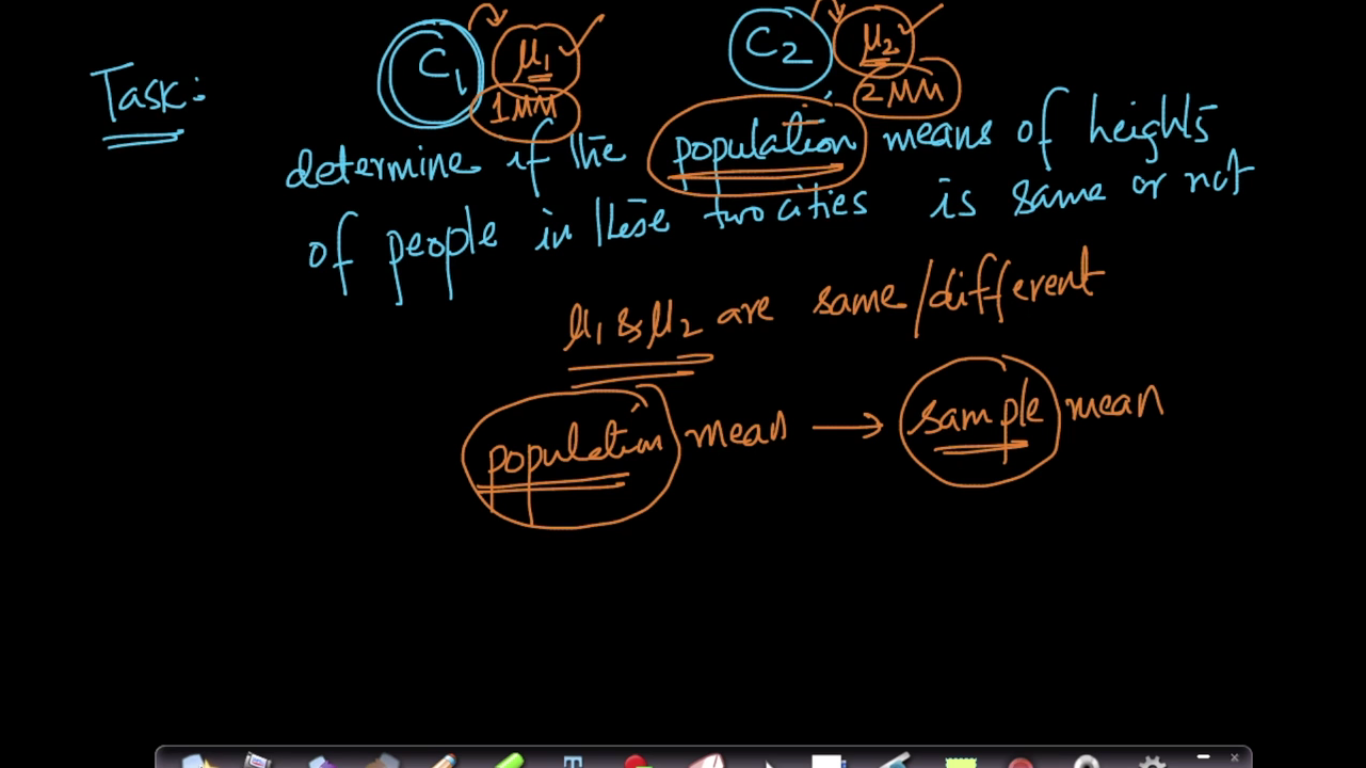
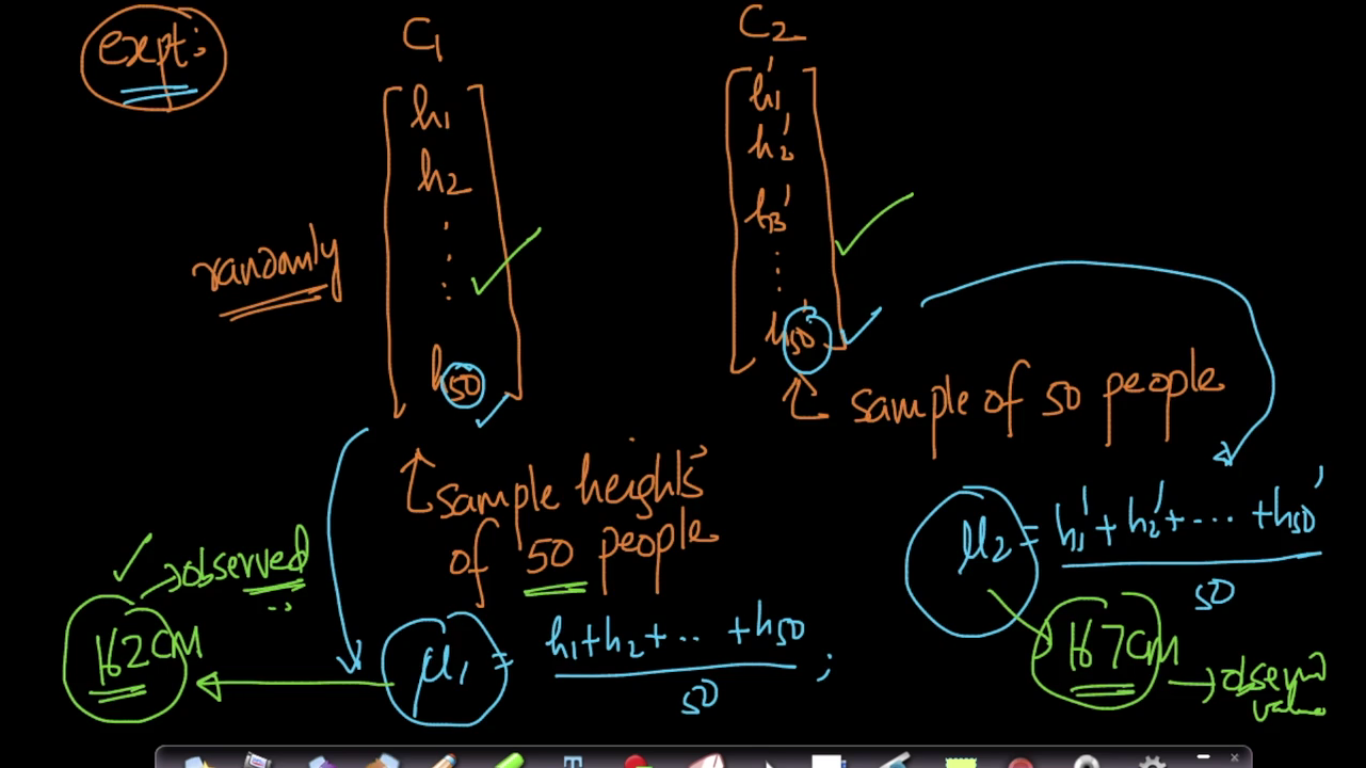
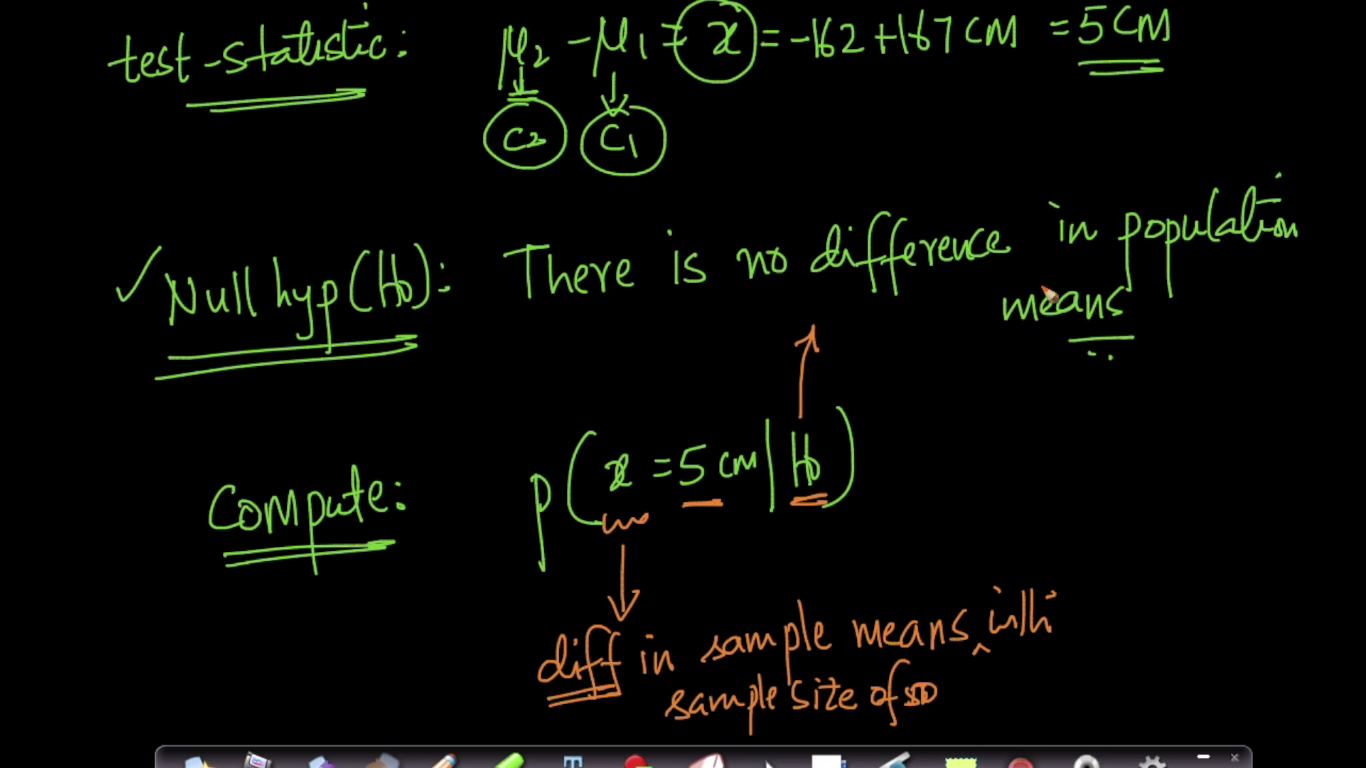
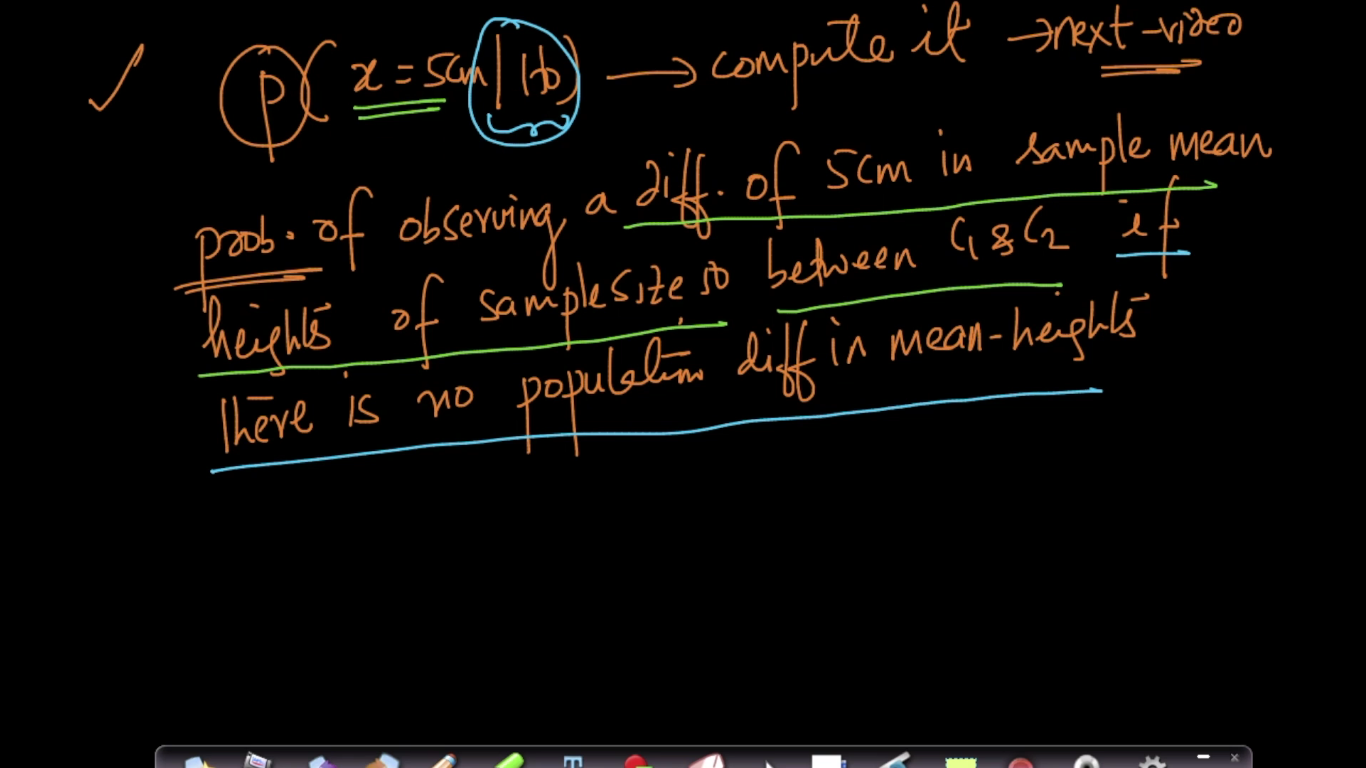
Hypothesis testing Mean differences Example
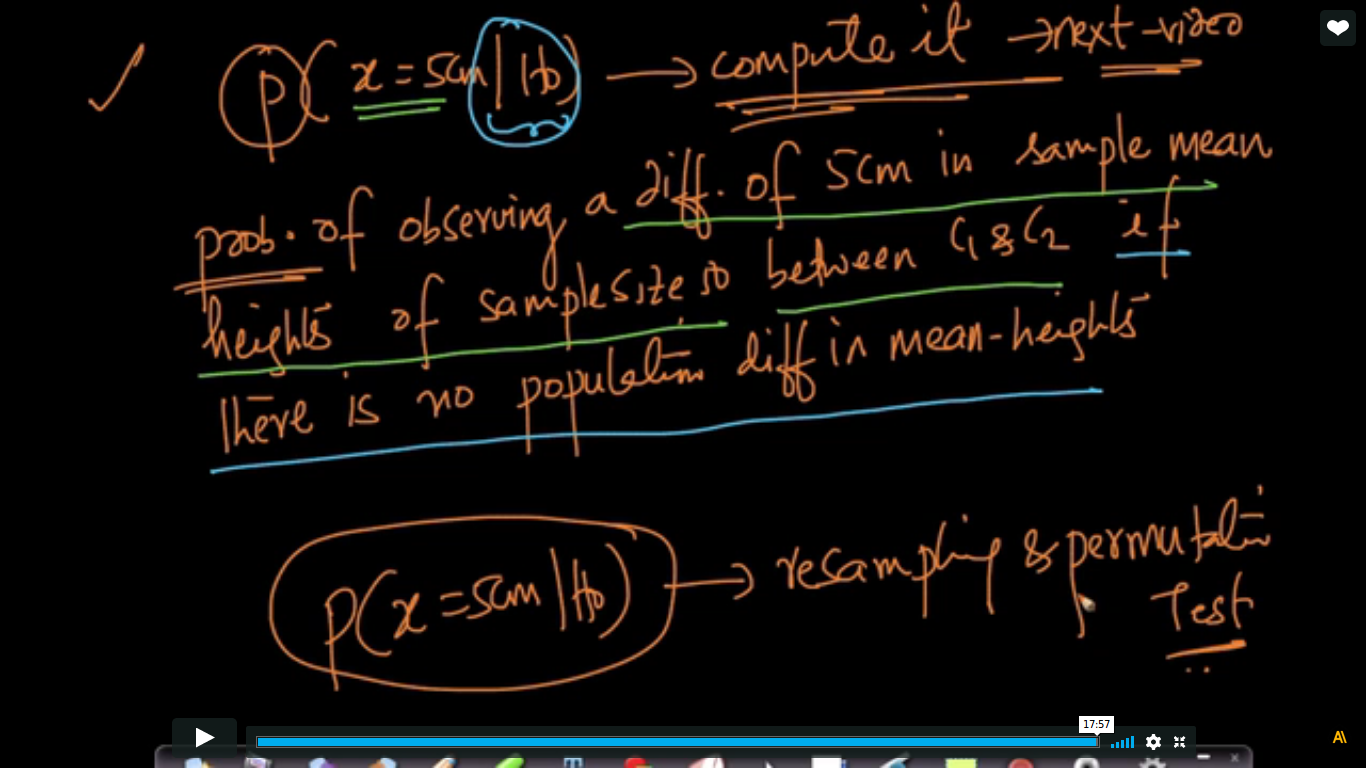
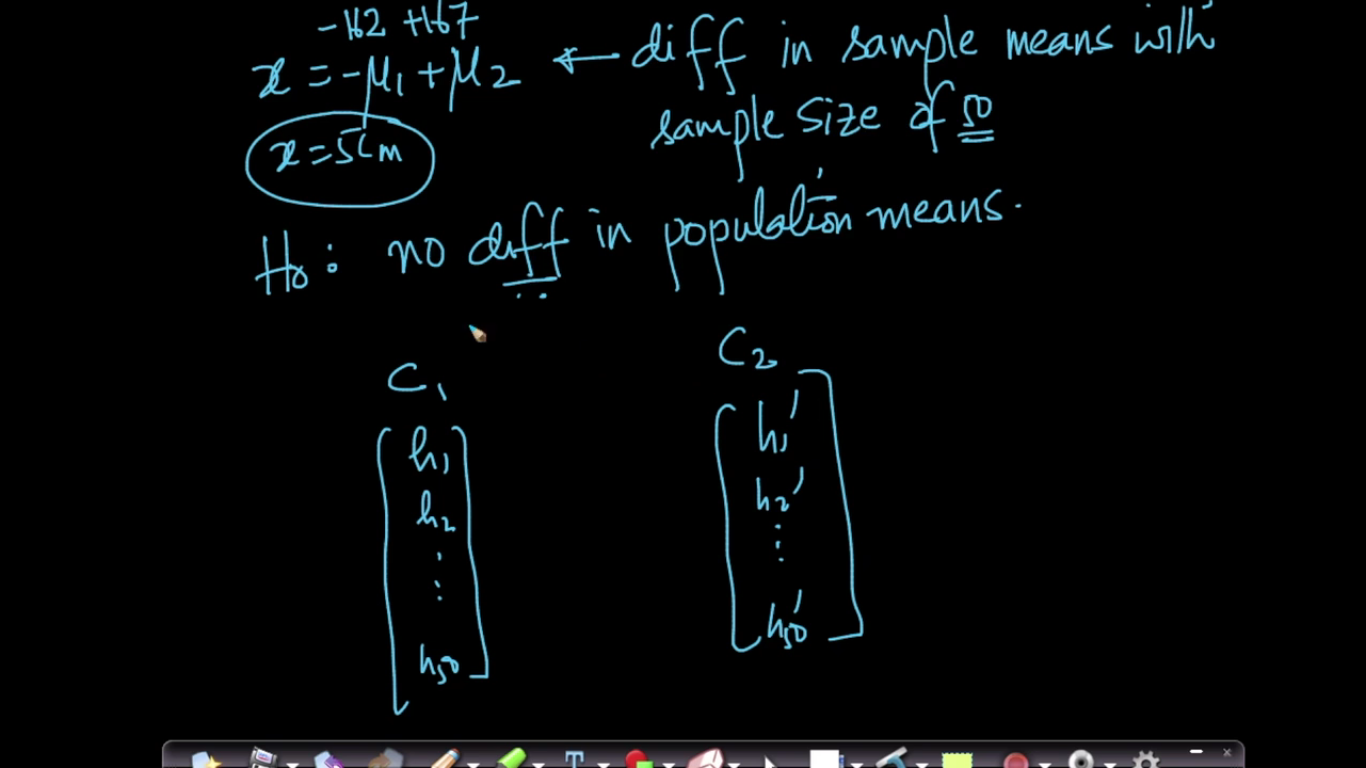
Now, we are taking another task which is more difficult than the previous one. So, in order to check the population mean of heights of the people from both the cities, it's not easy to go to every people and ask for heights. Hence we will compute the sample mean which is the subset of the overall population.
Página 5
Resampling and Permutation test for Mean difference example
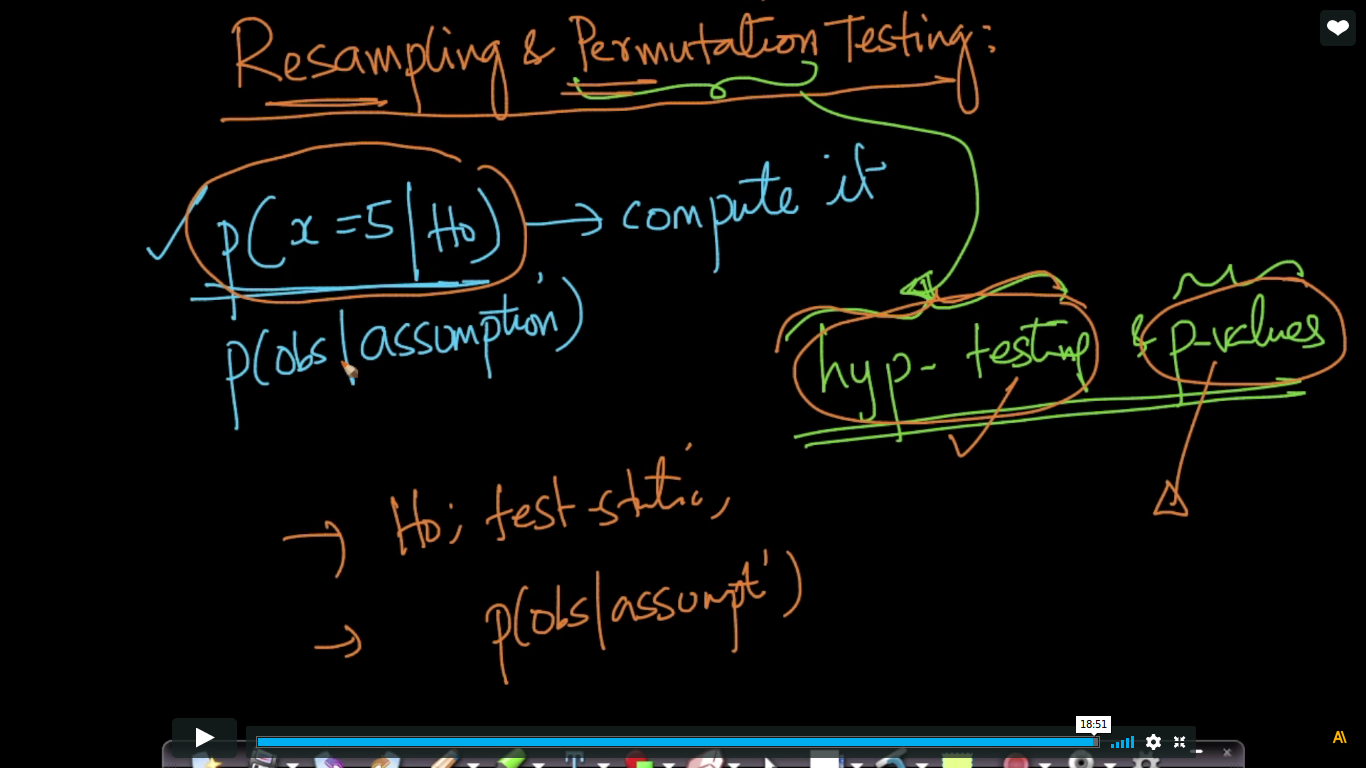
Here, we will compute P(x=5 | H0) we d left over in the last topic.
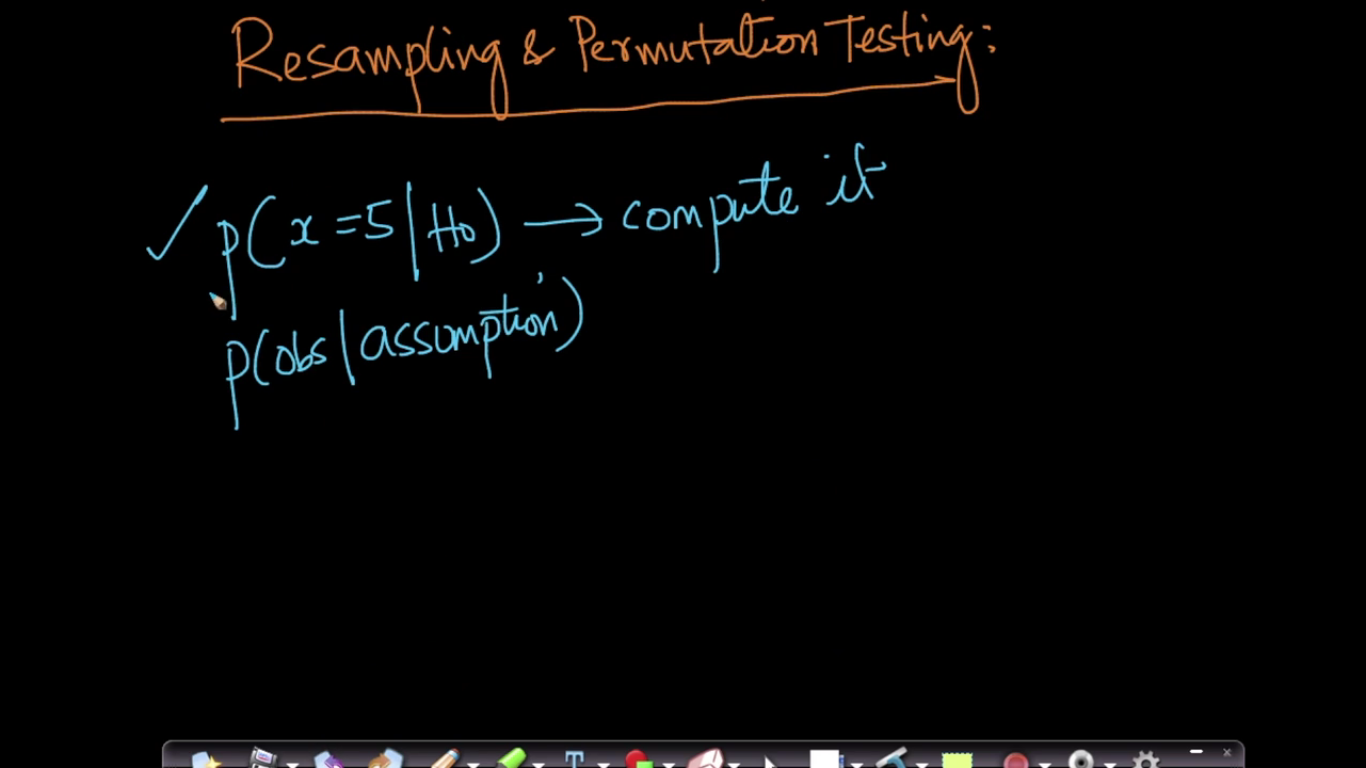
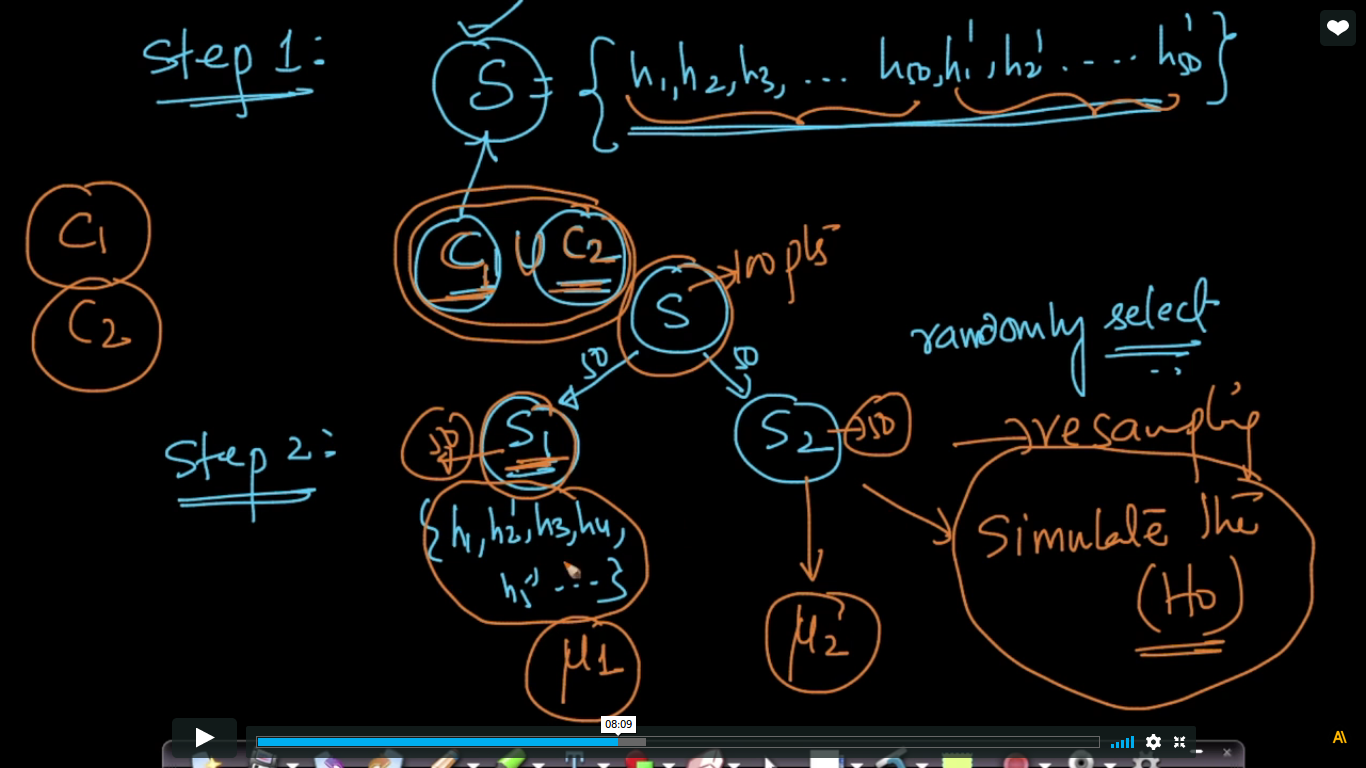
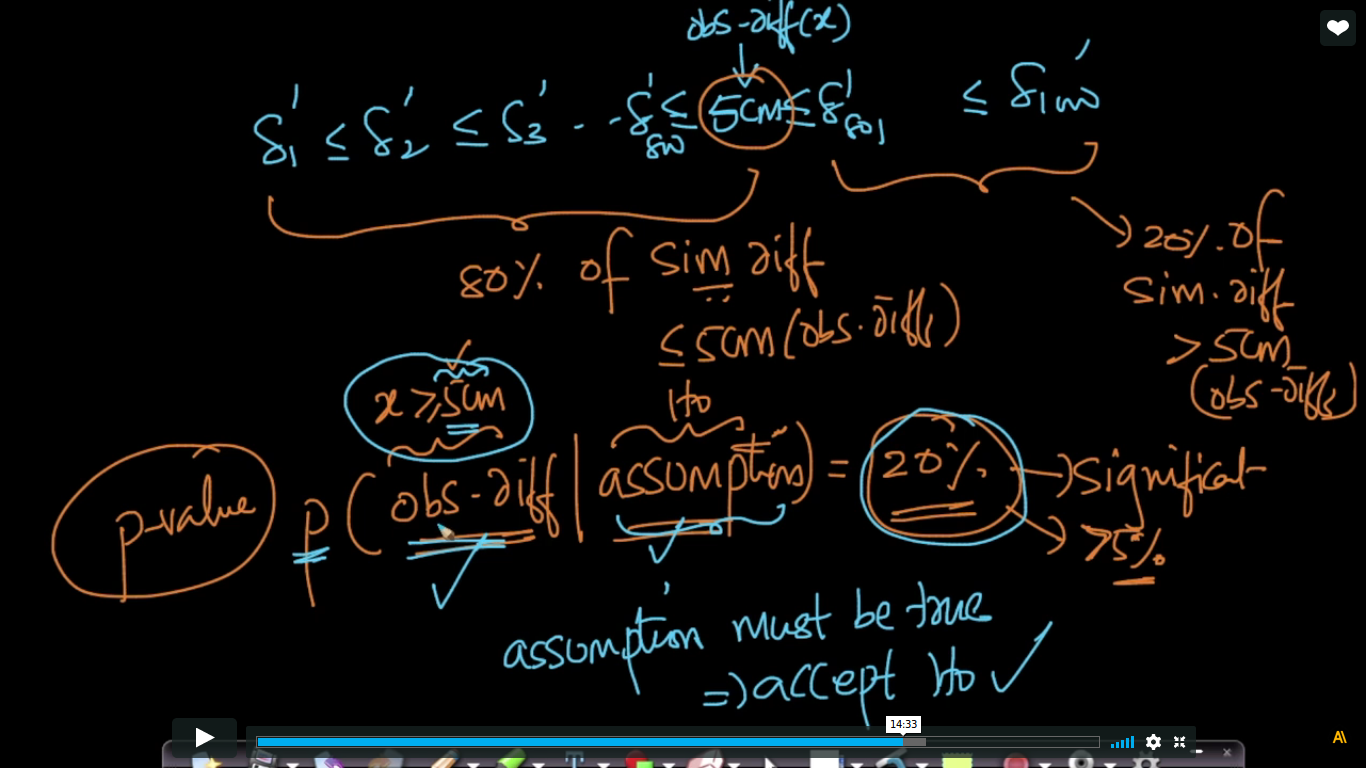
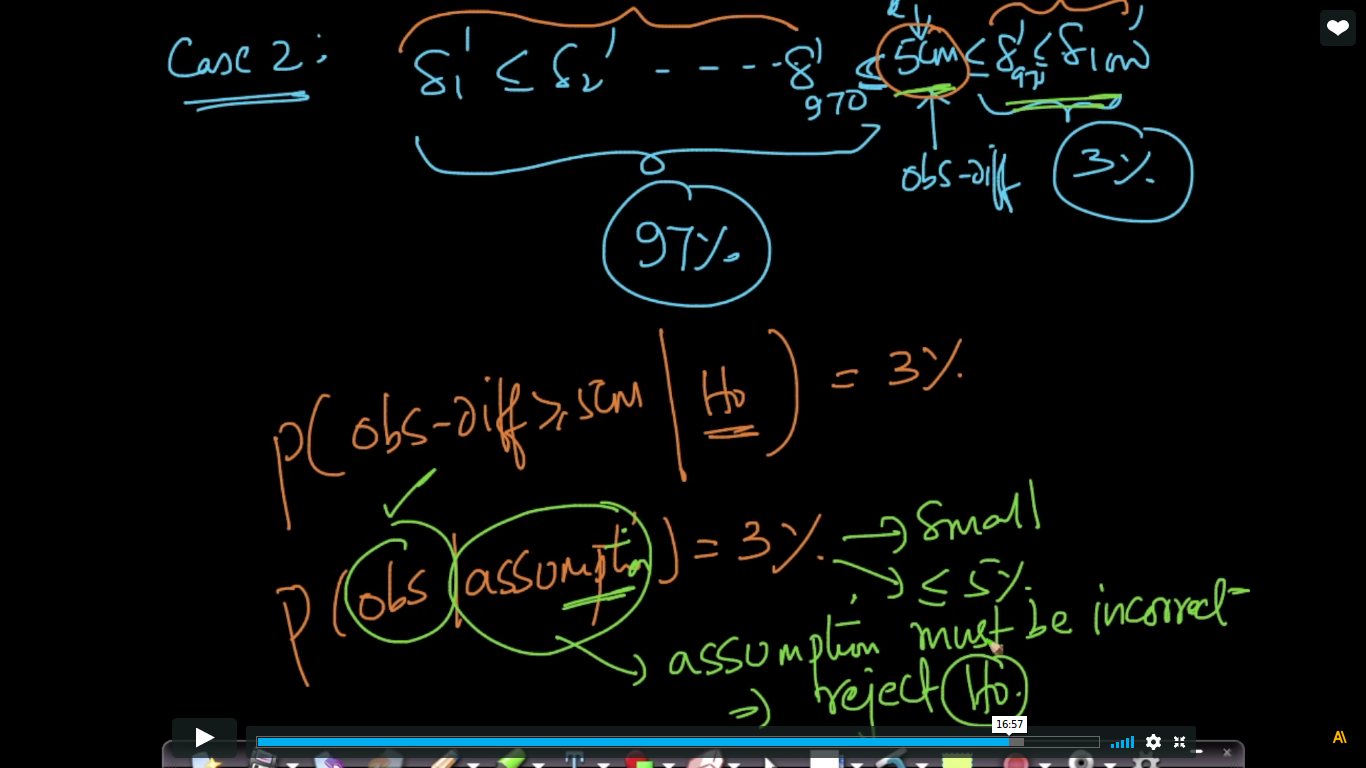
Resampling: It means that we jumble all the heights in the set S and then distribute into S1 and S2.
The purpose of doing resampling is to simulate the null hypothesis(H0) which assumes there is no difference between the heights of people in C1 and C2.
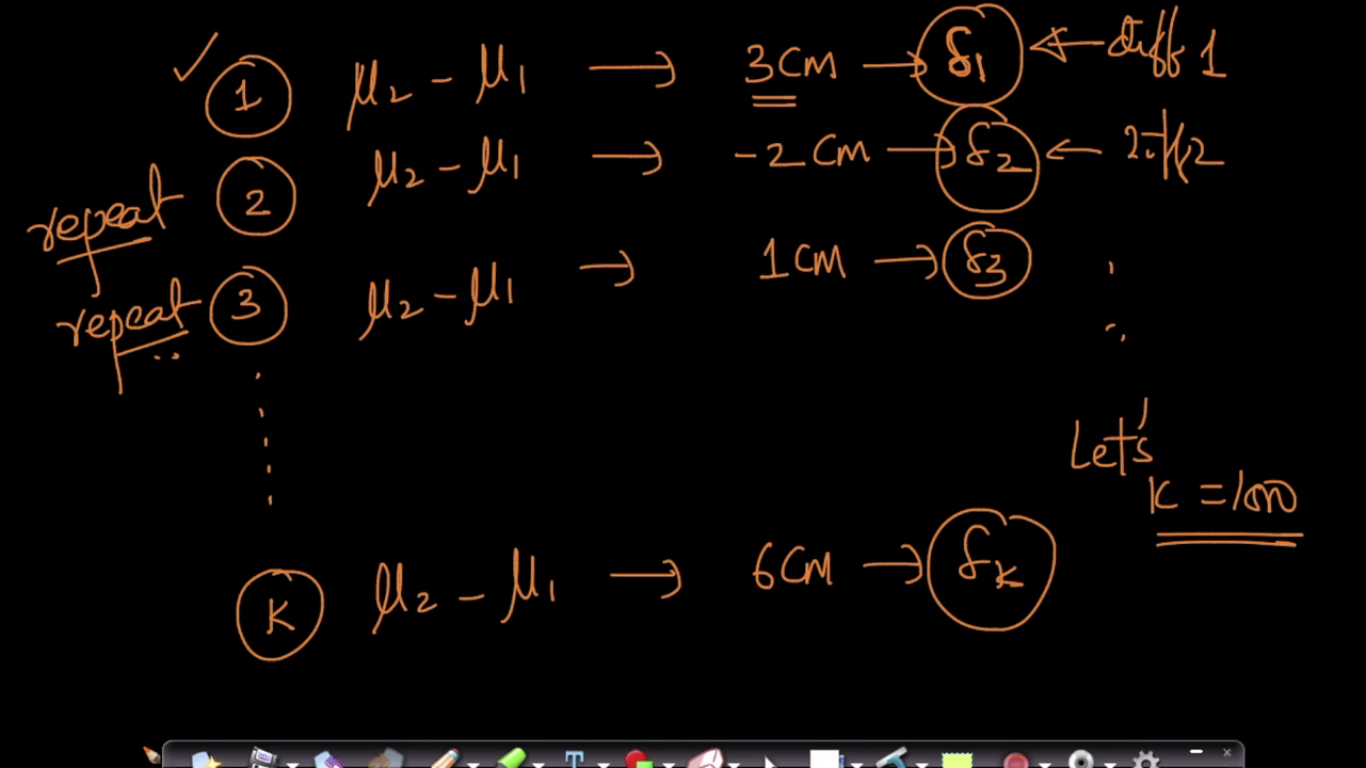
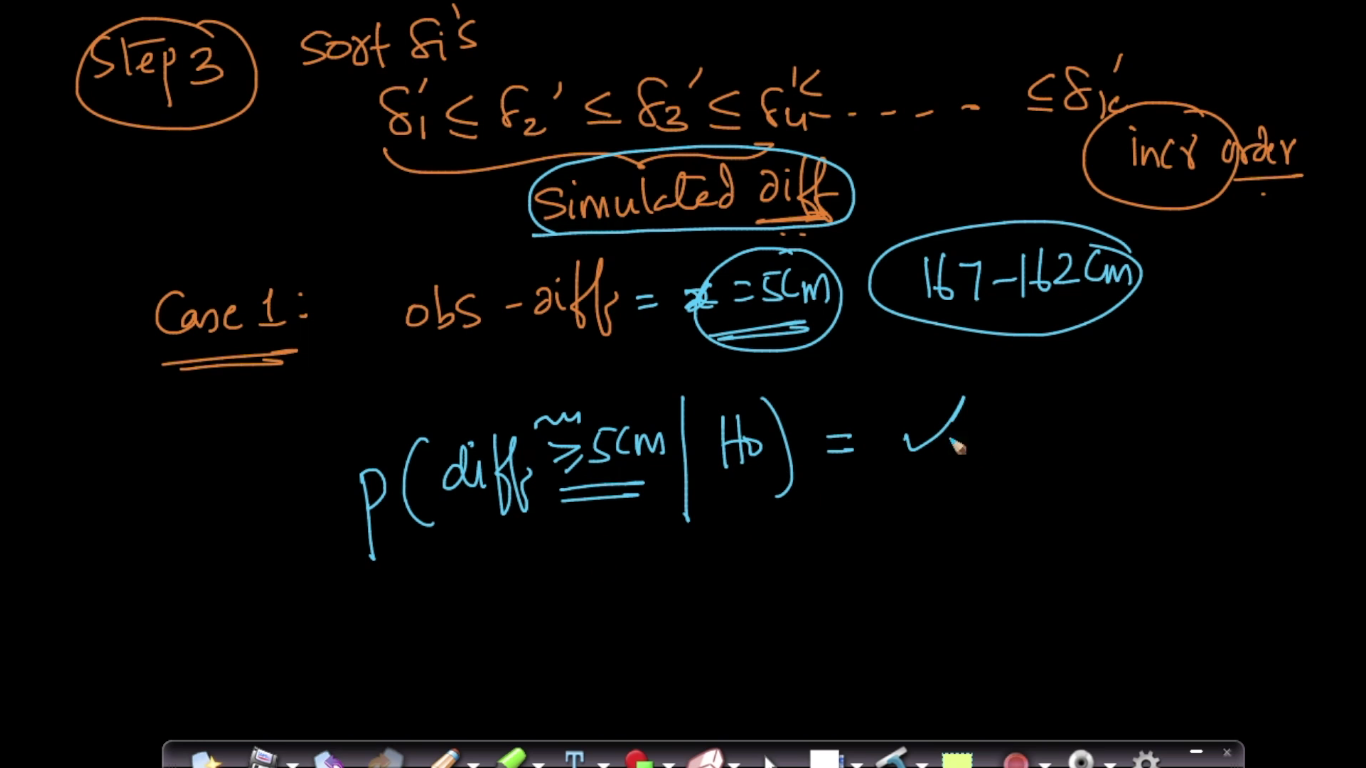
See below: If we observed difference is 0cm then we don't worry about it. The more difference you see, the less probable is our null hypothesis.
Things to Remeber - Very Imp Idea(Hypothesis Testing) used more frequently.
1. What is your null hypothesis?
2. What is our test statistics?
3. What is the sample size you are using in test statistics?
4. What is the probability that you are computing, P(observation | assumption)?
All should be very clear.
Note:
I have a query though.
Why do we consider P(X>=5|H0) and not P(X<=5|H0)?
Doesn't X=5 if H0: u2-u1 =0 ?
Because taking P(X<5|H0) is useless as we expect X to be small anyway as per our null-hypothesis. We cannot disprove H0 by contradiction by computing p(X<5|H0). Please check out these videos:
1. Most frequently asked questions about this topic:https://www.youtube.com/watch?v=2VE6AZPS6bI
2. How we setup hyp-testing as a proof by contradiction: https://www.appliedaicourse.com/course/applied-ai-course-online/lessons/hypothesis-testing-testing-methodology-null-hypothesis-p-value/
3. Coin-toss example: https://www.appliedaicourse.com/course/applied-ai-course-online/lessons/hypothesis-testing-intution-with-coin-toss-example/
While simulating deltas, we may get a single value multiple times. Ex: [1,5,3,5,2,4,6,7,5,2….upto k=1000], we are simulating 1000 deltas so we definitely have a chance that we may encounter single value multiple times(like 5cm may occur 10 times). Then we sort the deltas(simulated deltas) in increasing order. Now, what if the big delta(5cm as per video) lies between the thresholds. Ex: if the value 5cm lies between array index 945 to 955. So where does the big delta is supposed to lie in between this range? If we assume BIG delta lies between 945 and 946 we have to accept the null hypothesis since the p-value would be greater than 5%, in the same time if the big delta is between 954 and 955, then we have to accept the H0. What to do in such kind of cases?
Answer-
This is a good boundary case issue. If we encounter such a case, it is best to resample again to see if this phenomenon repeats itself many times. If so, you could say that you reject H0 at 6%-level and not a 5%-level as the p-value is between 5% and 6%.
Información
- Descripción
- Apunte sobre Probability & Statistics - Part 2, creado por Rohit Gurjar el 11/08/2018.
- Creado por
- Rohit Gurjar
- Visitas
- 6
- Valoración