
Apuntes
Predictions
Contenido del apunte (2)
Página 1
Prediction, IV & DV
Prediction
Relationship between an independent variable and a dependent variable.
Asymmetric where placement of variables matter.
Regression model.
Recall:
Association is symmetric where placement of variables does not matter.
Continuous variable - Correlation
Categorical variable - Contingency table, chi square, odds ratio
What are the similarities and differences between association and predictions?
Straight line functions
Predictions can be expressed as straight line functions.
y = m x + a
x is the independent variable
m is the constant for the slope
a is the intercept
y is the dependent variable
\(\widehat {y} \) denotes a y value that is on the line.
y denotes y value corresponding to a scatterpoint dot.
How do we get the best fit line for the scatterpoint dots?
By regressing the Y variable on the X variable (i.e. how much does the observed y value deviate from the predicted \(\widehat {y} \) value?.
The deviation in observed and predicted y values is called the residual value.
Note: The sum of all residual scores always = 0.
By using the least squares estimator where the min sum of \((y - \widehat {y})^2 \).
It is also known as the least squares regression function.
Linear regression model
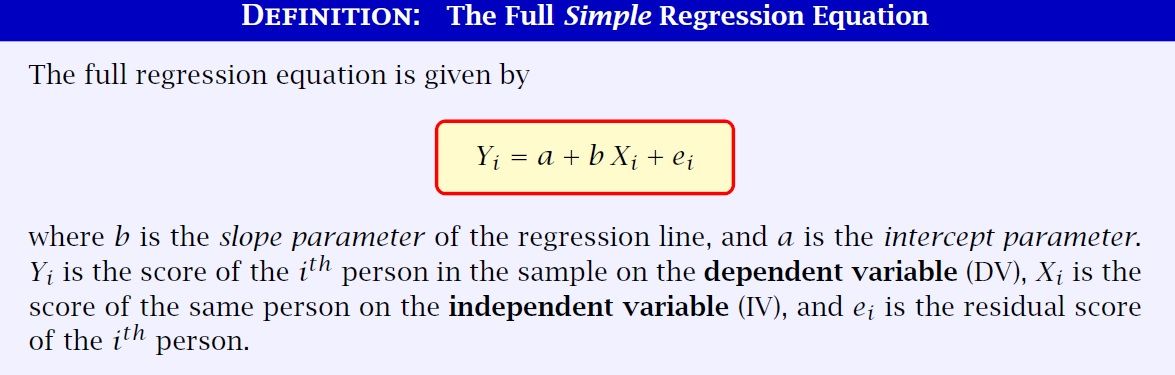
1. Full simple regression equation (y)
2. Simple regression equation (\(\widehat {y} \))
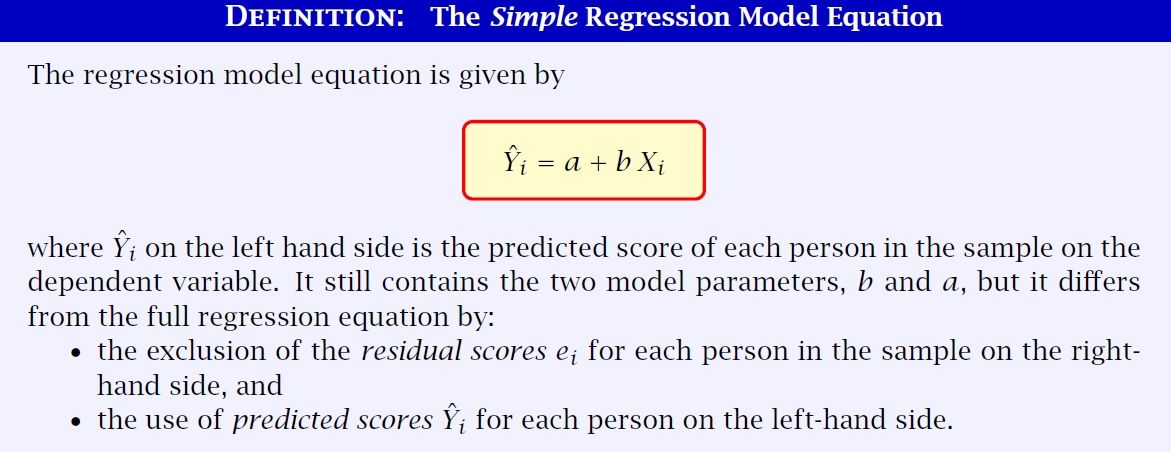
b is the regression coefficient.
e = Y - \(\widehat {Y} \)
Both regression equations depend on the no of IVs.
Simple regression models contains 1 IV
Multiple regression models contain 2 or more IVs.

b in multiple regression equations are known as partial regression coefficients.
Each IV has their separate coefficient.
Página 2
Strength of prediction, R-squared, regression coefficients
Interpreting linear regression models
We can derive the following:
Strength of overall prediction
Strength of each individual IV
Note: Strong overall model does not imply that each IV is a good predictor.
Strong individual IV does not imply model is strong overall.
R-squared
\(R^2 \) statistic measures the overall strength of prediction for the model.
It measures the variability of scores of the DV in the regression model.
How is it derived?
3 types of sum of squared variations can be obtained.
Variation in observed scores Y
Variation in predicted scores \(\widehat {Y} \)
Variation in differences between Y and \(\widehat {Y} \)
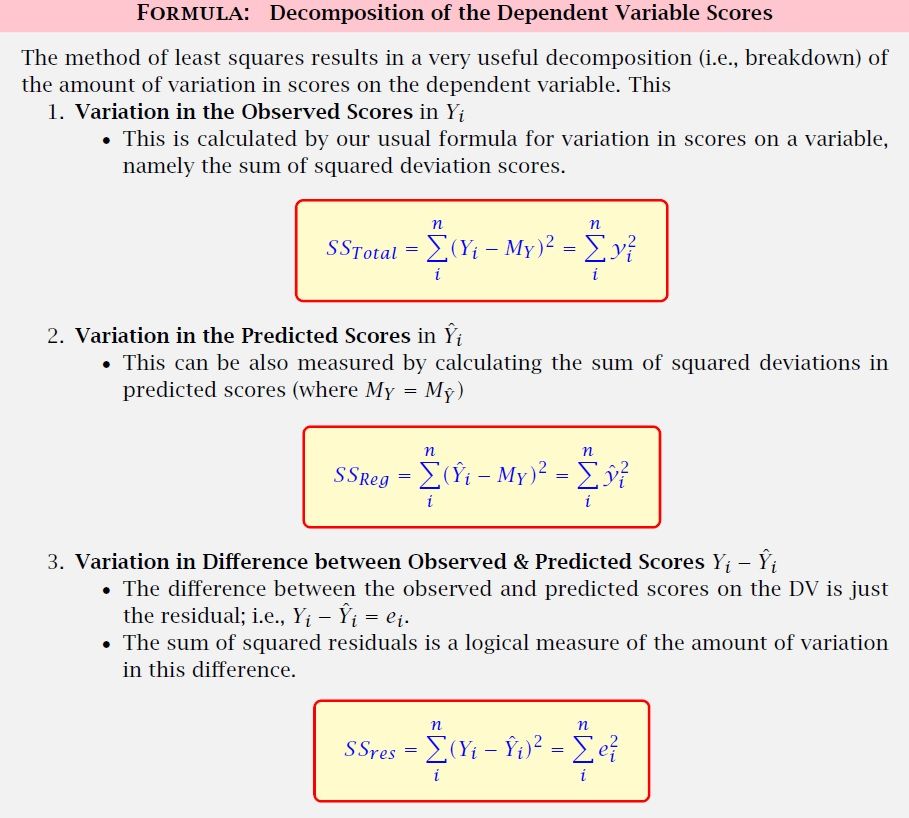

Where 0 \(\leq\) \(R^2 \) \(\leq\) 1.
To take it a step further, we can determine the correlation strength between observed and predicted DV (Y) scores.
Multiple correlation coefficient
R = \(\sqrt{R^2}\) where 0 \(\leq\) \(R^2 \) \(\leq\) 1.
It is interpreted where higher observed scores for DV is associated with higher predicted scores for DV.
Strength of individual IV for simple and paritial
It can be assessed in 3 ways
Unstandardised regression coefficient
Standardised regression coefficient
Semipartial correlation (multiple regression)
Unstandardised simple regression coefficient
Expected change in raw scores of the DV with 1 unit change in the raw scores of the IV.
Interpreting the coefficient
Size
Direction
+ coefficient - Increase in IV results in an increase in DV
- coefficient - increase in IV results in a decrease in DV
Standardised simple regression coefficient
If all the raw scores were changed to standardised form, i.e. Z scores...
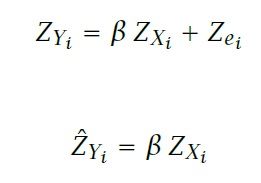
where \(\beta\) denotes standardised regression coefficient.
Note: Intercept is left out as it is always 0 in standardised form.
Definition:
Expected change in Z score units on the DV for 1 SD change on IV.
Interpretation of coefficient is the same as unstandardised.
Unstandardised partial regression coefficient
Definition: The expected change in the DV with 1 unit change in the focal IV given that all other IVs are held constant.
Likewise, a standard partial regression coefficient is defined as the expected change in the Z score of the DV with 1 SD change in the focal IV given that all other IVs are held constant.
Finally...
Regression intercept
Definition: Expected value of the DV when the scores on all IV (given more than 1 IV) is 0.
Note: Intercept = 0 in standardised regression equation.
Información
- Descripción
- (Predictions) Research Methods for Human Inquiry Apunte sobre Predictions, creado por orange oranges el 25/03/2017.
- Creado por
- orange oranges
- Visitas
- 0
- Valoración