
Apuntes
Science Practical Notes
Contenido del apunte (1)
Página 1
DRAWING LINE GRAPHS
Line graphs are the most
common type of graph you draw in Science. They are used when presenting
continuous data where two variables are used.
An appropriate line graph
should:
·
be drawn using a sharp pencil
·
have a clear and descriptive title
·
display the independent variable on the x-axis (the variable the
experimenter purposely changes in an experiment)
·
display the dependent variable on the y-axis (the variable which changes
in response to changes in the independent variable)
·
have axes with a clearly-marked, even scale that increases with even
increments
·
always have the vertex representing (0,0)
·
have a scale which allows the range of
data displayed to extend over more than half the grid in both directions (if the data is spread over a small range this
can be done by starting at zero at the vertex, using a hash or a zig-zag, then
starting with a value close to that of your smallest value)
·
have axes labelled with the appropriate quantity
·
have axes labelled with the appropriate units
·
have accurately plotted points drawn as neat, small crosses
·
a line or curve of best fit is required to represent a trend (unless
told to not join the centre of each cross)
·
have a clear key if more than one line is shown on a graph using
different lines (not points) for
different data sets
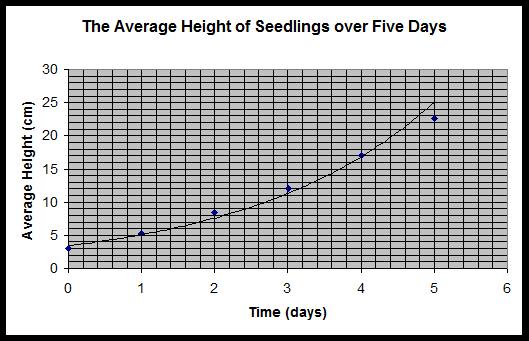
AN EXAMPLE OF A GRAPH
NB.
The points in the graph above should be drawn as crosses!
Using
the graph to predict results:
1.
Interpolation
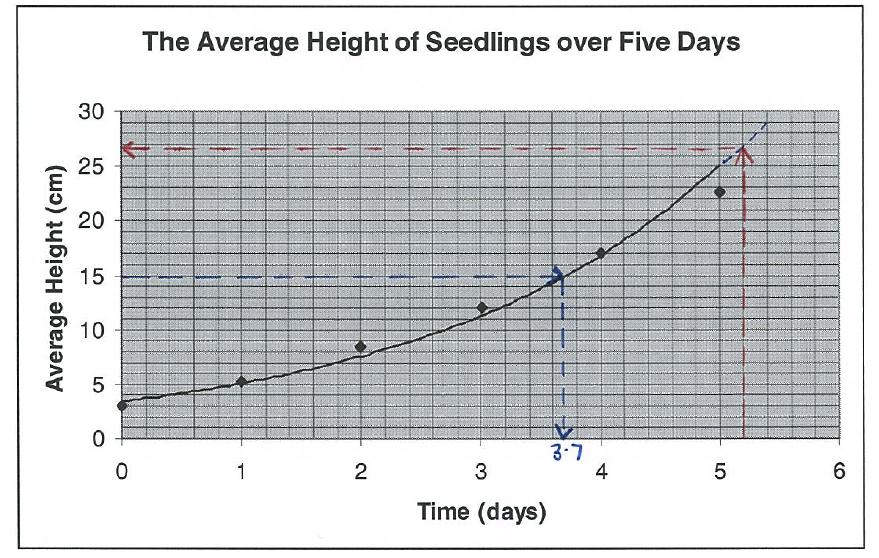
eg. using the graph predict how many days
it would take for the seedling to reach a height of 15 cm. Two lines must be
drawn on the graph as shown below.( a line from 15 cm on the y axis until it
hits the graph and then a line down to the x axis which will give the expected
number of days which is about 3.7 days).
2.
Extrapolation
eg.
using the graph predict how high the seedling would be after 5.2 days. The line
on the graph must be extended as shown and then two lines must be drawn on the
graph as shown below (a line from 5.2 days on the x axis until it hits the
graph and then a line across to the y axis which will give the expected height
which is about 27 cm).
Validity and reliability are
terms that are applied to both first-hand and second-hand investigations. You
should refer to each of the following aspects of an investigation if you are
asked to evaluate its validity and reliability
VALIDITY
Validity
describes how sound a process is.
Validity for 1st
hand investigation depends on making sure it is a fair test. The following
points are important:
·
controlling relevant variables
(only the independent variables should change)
·
using the most appropriate
equipment
·
using a suitable range of
independent variables to ensure the aim is tested.
Validity for 2nd
hand investigations depends on:
·
whether the information relates
to the problem or hypothesis being investigated
RELIABILTY
Reliability describes
how likely the same information/results will be found by others.
Reliability for
1st hand investigations is determined by repeating the experiment and averaging
of consistent results (identifying and eliminating outliers).
Reliability for
2nd hand investigations depends on
·
credentials of author/s
·
type of publication (e.g.:
.government, .edu better than .com and books generally gone through a more
stringent editing process)
·
date of publication (i.e.:
currency of information)
ACCURACY
Accuracy for 1st
hand investigations depends on the design of the experiment (i.e. the validity
of the method) and the sensitivity of the instruments used.
Accuracy for 2nd
hand investigations depends on whether the same/similar info can be found in
other VALID sources.
If you are asked
to evaluate the validity of either a first hand or second hand investigation,
you are expected to look at individual criteria and give an overall assessment.
Please do NOT confuse reliability with validity but DO recognise that both reliability
and validity increase the ACCURACY of the investigation.
VALIDITY, RELIABILITY & ACCURACY
WRITING A SCIENTIFIC METHOD
EXAMPLE: “An electronic balance was used to record the mass of one
teaspoon of sodium chloride, in grams, correct to two decimal places”
OR
“The mass of one teaspoon of sodium chloride was recorded, using an electronic
balance, in grams, correct to two decimal places”
A procedural
recount should be written impersonally. You
should not use terms such as I and we.
EXAMPLE: “Water
was poured to the beaker”
NOT
“I poured water into the
beaker” or “Poured water into the beaker”
E.
Drawing a scientific diagram.
To draw an appropriate scientific diagram you should:
Ø use a sharp pencil
Ø use a ruler
Ø draw using unbroken lines
Ø draw it in 2D
Ø make sure the diagram is an appropriate size (approximately 1/3 of a
page)
Ø label each piece of equipment
Ø draw each piece of equipment in proportion
Ø draw the equipment as it is set up, not separately
Ø not include equipment such as electronic balances
F.
Presenting your results.
The results you record should be observations only. No inferences
should be made.
Ø If you are collecting numerical data, use a table to present your results (following the SCEGGS guidelines).
Ø If your collected data allows it, a graph should be plotted (following the SCEGGS guidelines).
Ø If no numerical data was collected, then write out your observations
as clearly as possible (a table might still be appropriate here).
G. Include
a discussion.
A discussion
explains your experiment to another person. It should include:
Ø an explanation of your
results.
Ø the identification of errors
in your experiment.
Ø an assessment of the reliability
of the experiment (repeat and average).
Ø an assessment of the validity
of the experiment (comment on; how well the variables are controlled, if
the most appropriate equipment was used, if there was a suitable range of
measurements).
Ø any suggestions of improvements
that could be made to increase the accuracy of the experiment.
H. Writing a conclusion.
The conclusion should be one
sentence that answers the aim specifically. It should be a general statement
that does not include any results or personal pronouns.
EXAMPLE: As the temperature
of the water increased, the time taken for the sugar to dissolve decreased.
A.
Give your report a descriptive
title.
B.
Include an aim.
Ø Start your aim with the words To
investigate, To determine or To observe.
Ø The aim should include both variables that you are investigating.
Ø Your dependant variable is usually written first, the independent
variable written second.
EXAMPLE:
To investigate the
relationship between plant height and the mass of fertiliser added to the soil.
dependent variable independent vaiable
C.
Include an equipment list.
D.
Writing a detailed and concise method.
A method should be written such that anyone who reads it could carry
out the experiment without difficulty. A method should also mention how each
aspect of the experiment is controlled.
1.
Use numbered steps (to be
clear, use one numbered step for each action carried out)
2.
Do not omit any steps carried
out in your method or write them out of order, but keep each step brief and to
the point.
3.
Name all equipment used in each
step.
4.
Mention exact quantities of
measurements taken and the units used.
5.
If possible, record how accurately
you took your measurements (ie “…to two decimal places”, or “…to the nearest
mm”).
6.
For reliability, each set of
results should be repeated at least 3 times and then averaged, to reduce
inconsistent readings.
EXAMPLE:
Using an electronic balance, record the mass of one
teaspoon of sodium chloride, in grams,
equitmant used exact quantity used units used
correct to two decimal places.
accuracy of equipment
A method can be
written in two ways, depending on when you conduct the experiment. If you are
simply planning a method (or writing it before you carry it out) then it can be
written as a series of steps in the present tense such as:
EXAMPLE: “Using an electronic
balance, record the mass of one teaspoon of sodium chloride, in grams, correct
to two decimal places”.
However, if you
are writing a scientific report AFTER you have carried out an experiment, then
it is known as a procedural recount.
A procedural recount should be written in past tense.
CONSTRUCTING TABLES
1. All tables should have a title (heading) that tells the
person analysing the table what information is contained in the table.
2. A border surrounds the entire table. All lines in the table
must be ruled with a ruler.
3. The table should be written in pencil, so that changes can
be erased. Planning the format of the table may assist is reducing mistakes.
4. Each
column must have a heading. This will be the top cell in each column.
5. If a column contains measurements, the units of the
measurement should be placed in the column heading (within brackets). The unit
should NOT be repeated in each cell underneath the heading.
For example: If the temperature of water
was measured each minute, the column heading would be: “Temperature (0C)”.
A ROW OF A TABLE
6. Observations
and/or data in each column should be aligned.
7. A zero should only be included when a measurement of zero
was obtained; a dash should be used when no reading was recorded.
8. Identical
results should be written again-not shown with ‘ditto marks’.
9. It is often appropriate and useful to show data for each
trial along with average values. Subtotals, totals and/or percentages can be
included.
AN EXAMPLE OF A
TABLE
A COLUMN OF A TABLE
BREED
OF DOG
MASS
(kg)
HEIGHT
(cm)
Labrador
35
43
Great Dane
80
75
cell of a table
TABULATION GUIDELINES
HELLO, WITH THESE PAGES DON'T FORGET TO PULL THE PAGES DOWN TO SEE MORE :)
Graph Tips
VALIDITY, RELIABILITY & ACCURACY
WRITING A SCIENTIFIC METHOD
TABULATION GUIDELINES
HI
Información
- Descripción
- (Practical) Science Apunte sobre Science Practical Notes, creado por ClareArmstrong el 08/05/2013.
- Creado por
- ClareArmstrong · may 2013
- Actualizado
- 7 jul 2021
- Visitas
- 1.348
- Etiquetas
- Valoración