
Test
Visualizing Scaled-Valued Functions
Este test tiene tipos de pregunta que se abren en el reproductor de siempre.
Preguntas del test (5)
1When graphing a point in a cooridnate space, what is the order to plotting a point?
- AZ,X,Y
- BX,Z,Y
- CY,X,Z
- DX,Y,Z
2True or False, this is a sine/cosine graph.
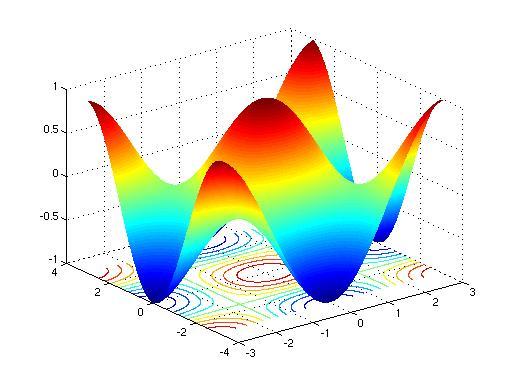
- AVerdadero
- BFalso
3Drag the numbers to the points with the most steep at 1 next 2, and so on
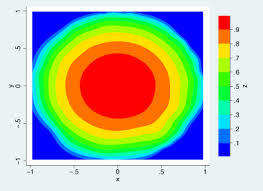
- A1
- B2
- C3
- D4
4Which of these points work for this function z = x^2 + 2xy + 2y^2
- A(2,5,74)
- B(3,2,17)
- C(0,-2,8)
- D(-3,0,8)
5what function would we get if we cut the graph z = cos(x)siny(y) at x = 0?
- Ay = cos(x)
- By = sin(y)
- Cy = 0
- Dx = 0
Información
- Descripción
- (week 2) multaviarible calculus Test sobre Visualizing Scaled-Valued Functions, creado por jason wheeler el 23/08/2017.
- Autor
- jason wheeler
- Idioma
- English
- Visitas
- 0
- Etiquetas
- Valoración
- Aún sin valoraciones Valora este test