
Normal Distribution
Diapositivas del conjunto (3)
-
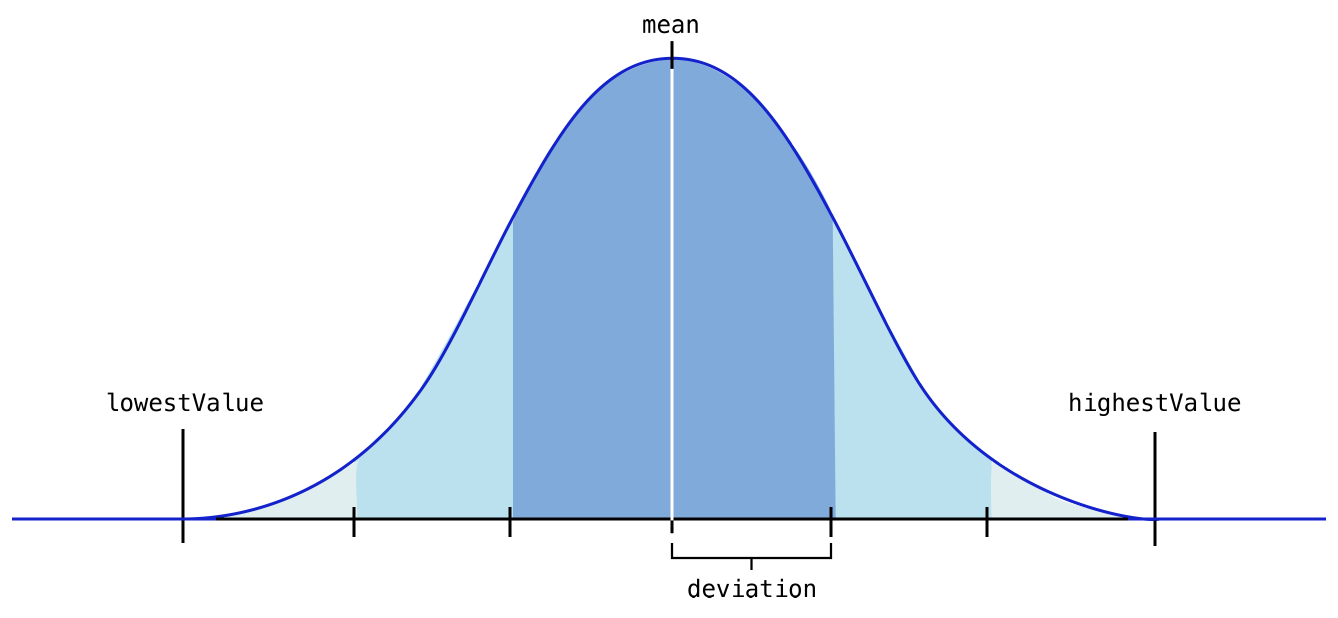
- X~N(μ,σ^2)
- The mean μ is always in the middle
- The graph is symmetrical about the middle
- The larger the value of σ^2 the more flat the curve
- The area between the curve and the x-axis is the probability
- P(X=a)=0
- https://www.mathsisfun.com/data/standard-normal-distribution.html
- Pie de imagen: A Bell Curve Graph
-
- Let Z be a Continuous Random Variable that is Normally Distributed with μ=0 and unit variance (σ^2), then Z is the Standard Normal
- ∴ Z~N(0,1)
- Use Table 7 in Stats Booklet
-
- Z=X-μ/σ ⇒ Z~N(0,1)
- NB: Divide by Standard Deviation
- Equations
- P(Z>a)=Q(a)
- P(Z<a)=1-Q(a)
- P(Z>-a)=1-Q(a)
- P(Z<-a)=Q(a)
- P(a<Z<b)=Q(a)-Q(b)
- P(-a<Q<b)=1-Q(b)-Q(a)
- P(-a<Z<-b)=Q(b)-Q(a)
Información
- Descripción
- A-Levels Further Mathematics Diapositivas sobre Normal Distribution, creado por Alex Burden el 21/04/2017.
- Creado por
- Alex Burden
- Visitas
- 139
- Etiquetas
- Valoración