18589746
Description
Flashcards by Nikolas Bosin, updated more than 1 year ago
|
|
Created by Nikolas Bosin
about 5 years ago
|
|
| Question | Answer |
| Pearson Correlation | measures the association between two metric variables --> shows the strenght of the asssociation but doesn't allow forecast |
| The simple linear regression model | - two variables in a linear realtionship to one another - no other factors have an effect |
| Why is there a stochastic errror added to the linear regression model? | To capture impact of all outer factors |
| How does the equation of the simple linear regression look like? | Yi= β0+ β1X1+ ε |
| How is called the most commonly used technique to estimate the data? (regression) | ordinary least squares (OLS) |
| How does the OLS work? | The method estimates the coefficients in the regression model using the logic: min∑(e^2) |
| What assumptions need to be made for the dependent variable (y)? | - Range: [-∞; +∞] - It may be a non-integer number - The units of measurement are constant - OLS thus only works (well) for continuous, metric dependent variables |
| What does "BLUE" stand for? | best linear unbiased estimator |
| When does the OLS produce the best linear unbiased estimator? | When all five assumptions of the simple linear regression are fulfilled |
| What is an unbiased estimator? | An estimator whose expected value is equal to the actual value |
| What are the assumptions about the independent variables (x)? (OLS) | 1. Regression model is linear in the parameters 2. The error terms have a mean of zero (exogeneity) 3. The error terms have constant variance (homoskedasticity) 4. Zero covariance between the error terms (no autocorrelation) 5. The variable x is not random (can be relaxed, but makes point 2 stricter), and must take at least two different values 6. The error term is normally distributed with zero mean and constant variance |
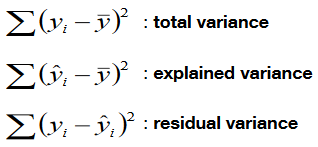
| Variance components | total variance = explained v. + residual v. |
| What is the idea of the F-Test? | The F-test considers, given the number of variables we have in our model, how likely it is that there is at least one variable explaining our dependent variable |
| What kind of test is the F-Test? | A significance test giving the probability that there is at least one variable that has a strng correlation with your dependent variable |
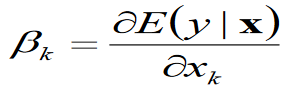
| What does this equation tell us? | This is the unstandardised coefficient that tells you smth. about a one-unit change of x on y (1st derivative) |
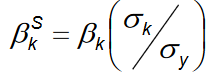
| Why do we standardise our coefficients? | Because it can be that there are major differences in the meaning of a one unit increase of two different variables (one variable is about income and one about cars this person has --> one unit plus in income is not comparable to one unit plus in cars) |
| What is the formula for standardisation of βk? | |
| Process of formulating a hypothesis and testing it looks like follows... | - Start from a body of theory - We create a hypothesis - This hypothesis needs to be falsifiable - What we are testing is wether the falsified hypothesis is true (e.g. theory = attendance has an effect on grade; falsified hypothesis = attendance has no effect on grade) - We call this the “Null hypothesis” H0: β = 0 - Alternative hypothesis H1: β ≠ 0 |
| How is the t-value calculated? | divide the coefficient by the standard error (take the absolute value) |
| How is the t-value distributed in large samples? | Normal distribution |
| What does the p-value tell us? | The p-value tells us how likely it is to get a result like this if the null hypothesis is true |
| What does a high p-value tell us? (higher than significance-level alpha) | that we have little evidence that the null hypothesis is incorrect --> so we keep H0 and reject H1 |
| What does a really low p-value tell us? (below significance level alpha) | That we have strong evidence that the null hypothesis is false --> reject H0 and keep H1 |
| What is the type I error (false positive)? | When a obviously wrong statement is stated as correct |
| What is the type II error (false negative)? | When a obviously correct statement is stated as wrong |
Want to create your own Flashcards for free with GoConqr? Learn more.