3437054
Description
Mind Map by thegarretbailey, updated more than 1 year ago
|
|
Created by thegarretbailey
over 8 years ago
|
|
Qudratic Mindmap
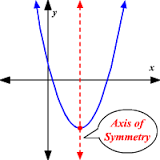
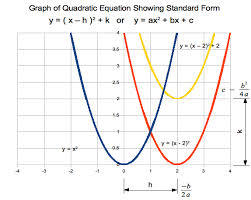
- axis of symmetry :A Vertical line that cuts the parabola into 2 equal halves/were it folds over to meet the other side of it
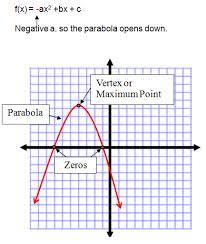
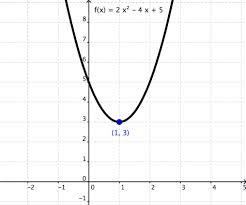
- vertex:The "peak" in the parabola/curve
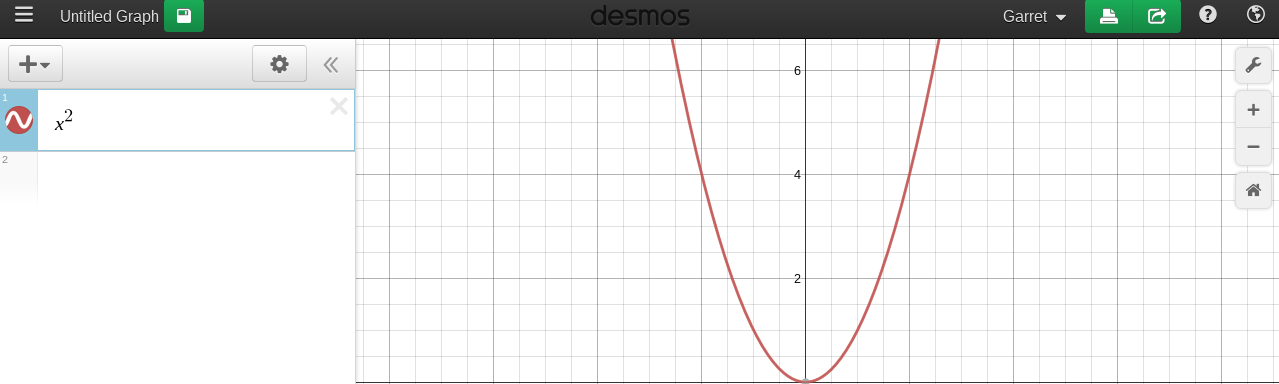
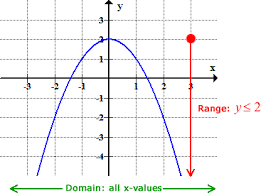
- parabola:a curve that is formed from the x being squared
- Minimum a Parabola that opens UP.
- Maximum a parabola that opens DOWN
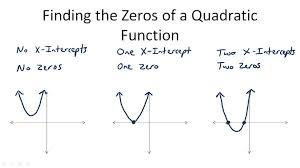
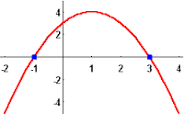
- x-intercept:Where the parabola crosses the X axis(Can have either 0,1,or 2 x intercepts)
- Y Intercept:Where the parabola crosses the Y axis
- zeros of the function he roots are called the x-intercepts of the graph. They correspond to points on
the graph that have y-coordinates of 0.
- roots of the equation A real number x intercept
- end behavior is the behavior of the graph of f(x) as x approaches positive infinity or negative infinity.
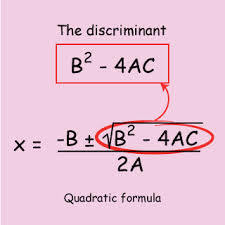
- discriminant:determines the kind of root the equation has.
- difference of squares a squared number subtracted from a perfect square.
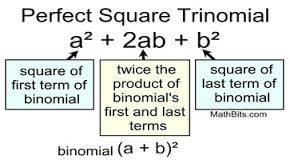
- perfect square trinomial a 3 termed polynonomial
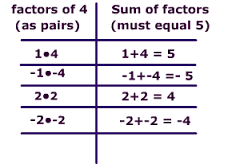
- factors of a quadratic finds the roots or x-intercepts of a quadratic equation.
Media attachments
Want to create your own Mind Maps for free with GoConqr? Learn more.